Uber Results Presentation Deck
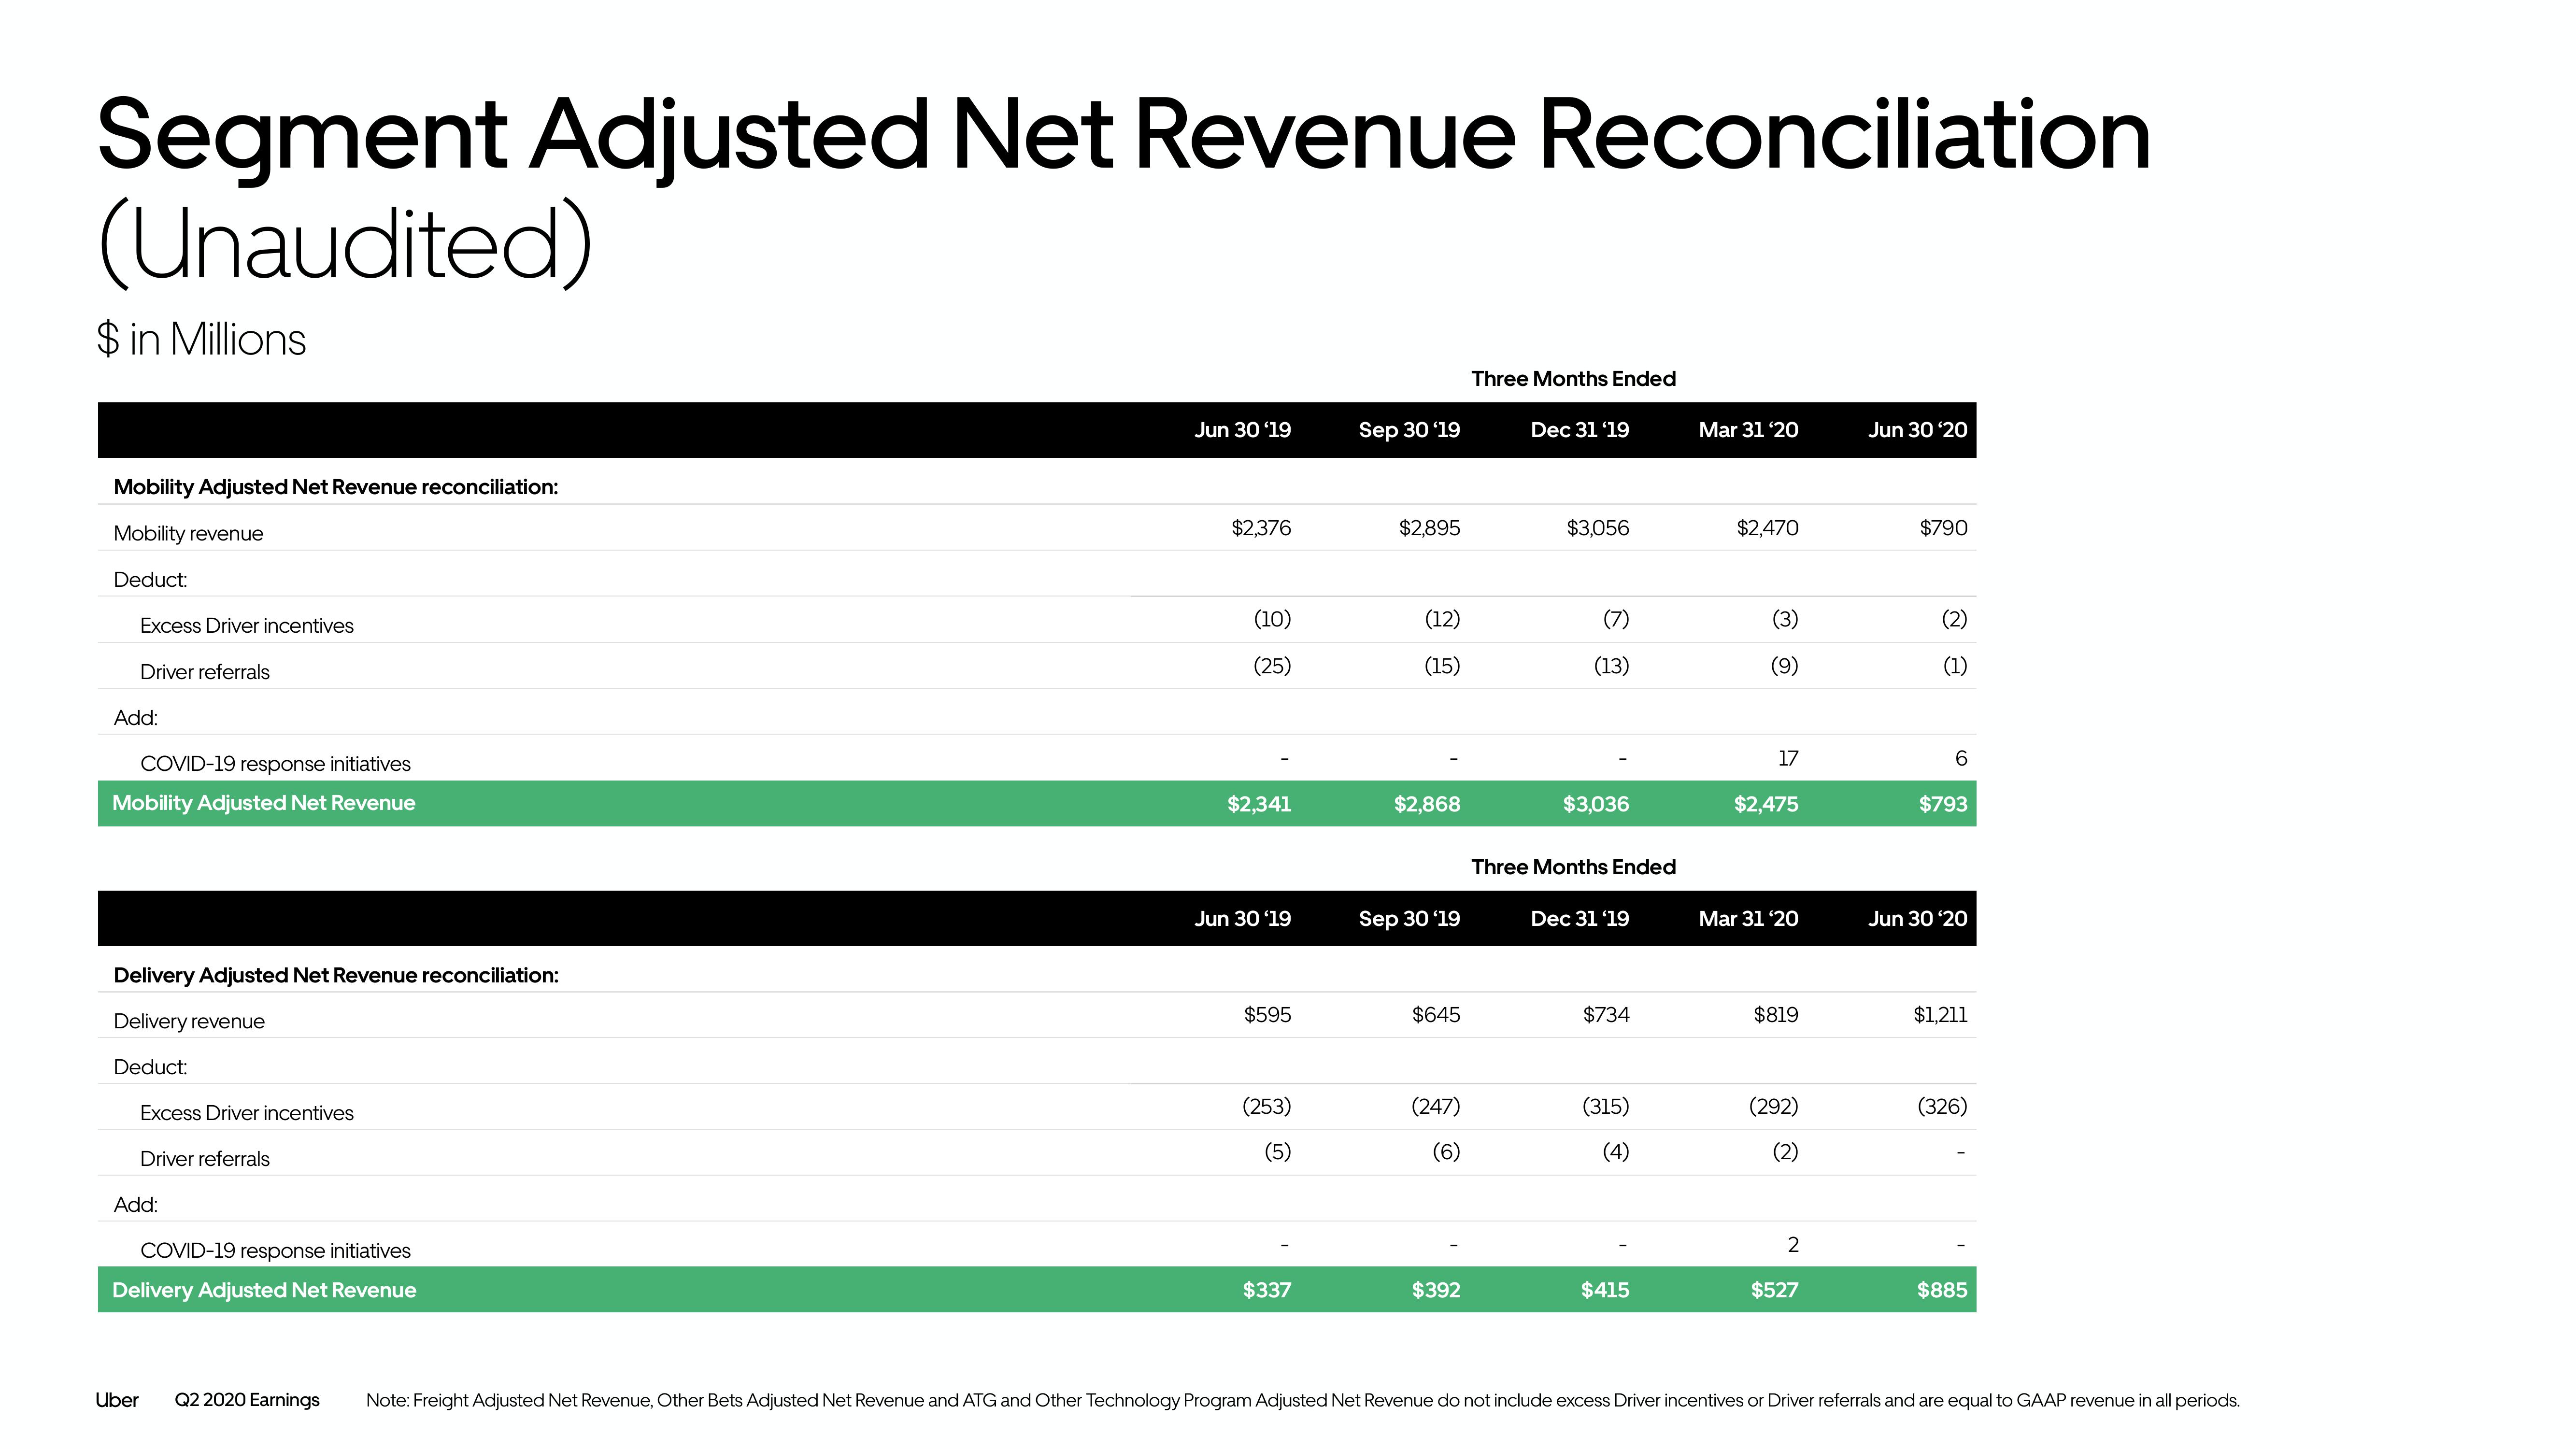
Segment Adjusted Net Revenue Reconciliation
(Unaudited)
$ in Millions
Mobility Adjusted Net Revenue reconciliation:
Mobility revenue
Deduct:
Excess Driver incentives
Driver referrals
Add:
COVID-19 response initiatives
Mobility Adjusted Net Revenue
Delivery Adjusted Net Revenue reconciliation:
Delivery revenue
Deduct:
Excess Driver incentives
Driver referrals
Add:
COVID-19 response initiatives
Delivery Adjusted Net Revenue
Uber Q2 2020 Earnings
Jun 30 '19
$2,376
(10)
(25)
$2,341
Jun 30 '19
$595
(253)
(5)
$337
Sep 30'19
$2,895
(12)
(15)
$2,868
Sep 30 '19
$645
(247)
(6)
$392
Three Months Ended
Dec 31 '19
$3,056
$2,470
HI
(7)
(3)
(9)
(13)
$3,036
Three Months Ended
Dec 31 '19
$734
(315)
(4)
Mar 31 '20
$415
17
$2,475
Mar 31 '20
$819
(292)
(2)
2
Jun 30'20
$527
$790
(2)
(1)
6
$793
Jun 30'20
$1,211
(326)
$885
Note: Freight Adjusted Net Revenue, Other Bets Adjusted Net Revenue and ATG and Other Technology Program Adjusted Net Revenue do not include excess Driver incentives or Driver referrals and are equal to GAAP revenue in all periods.View entire presentation