Flutter Results Presentation Deck
Appendices
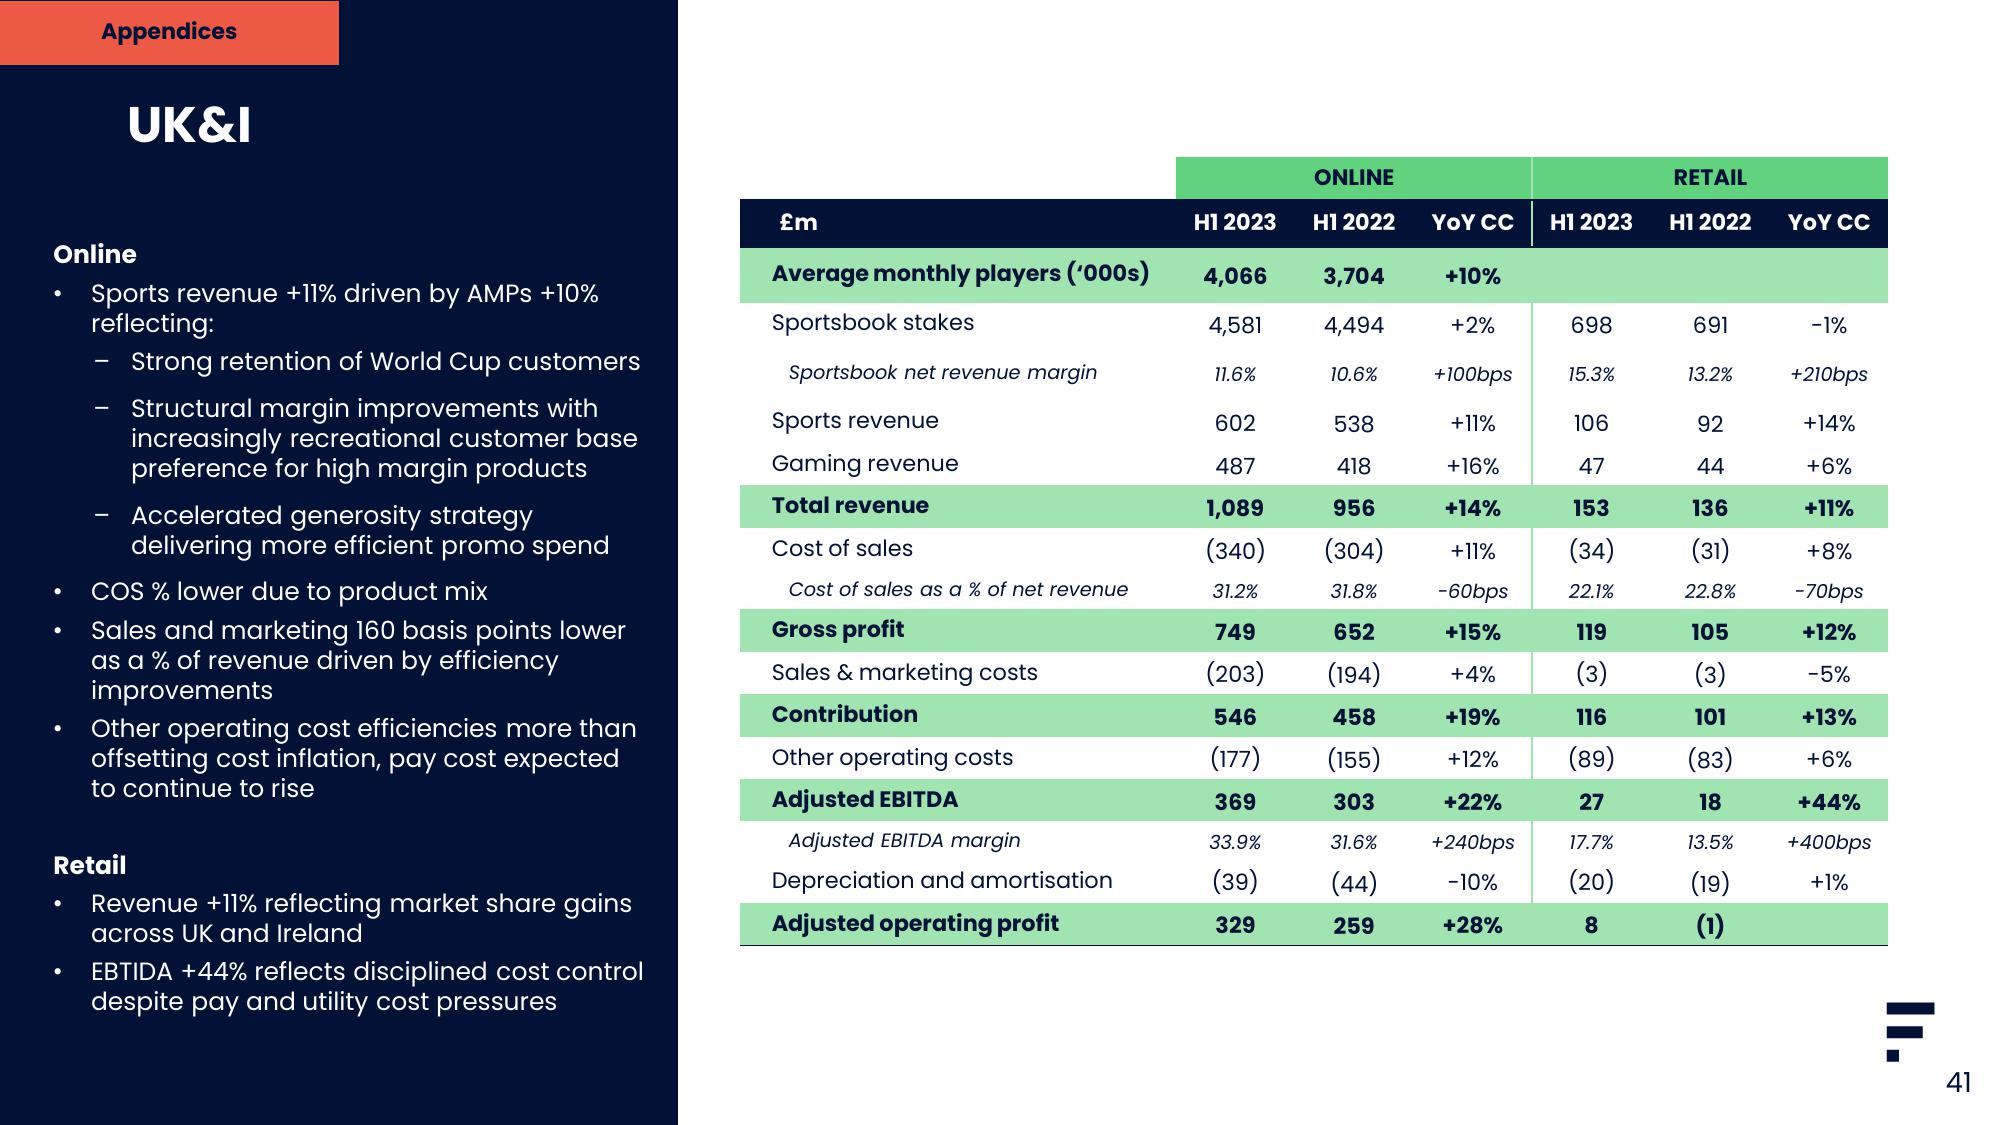
Online
Sports revenue +11% driven by AMPs +10%
reflecting:
Strong retention of World Cup customers
●
UK&I
Structural margin improvements with
increasingly recreational customer base
preference for high margin products
Accelerated generosity strategy
delivering more efficient promo spend
COS % lower due to product mix
Retail
Sales and marketing 160 basis points lower
as a % of revenue driven by efficiency
improvements
Other operating cost efficiencies more than
offsetting cost inflation, pay cost expected
to continue to rise
Revenue +11% reflecting market share gains
across UK and Ireland
EBTIDA +44% reflects disciplined cost control
despite pay and utility cost pressures
£m
Average monthly players ('000s)
Sportsbook stakes
Sportsbook net revenue margin
Sports revenue
Gaming revenue
Total revenue
Cost of sales
Cost of sales as a % of net revenue
Gross profit
Sales & marketing costs
Contribution
Other operating costs
Adjusted EBITDA
Adjusted EBITDA margin
Depreciation and amortisation
Adjusted operating profit
H12023
4,066
4,581
11.6%
ONLINE
Hồ 2022
749
(203)
3,704
4,494
10.6%
602
538
487
418
956
1,089
(340) (304)
31.2%
31.8%
652
(194)
458
(155)
303
546
(177)
369
33.9%
31.6%
(39) (44)
329
259
YOY CC
+10%
+2%
+100bps
+11%
+16%
+14%
+11%
-60bps
+15%
+4%
+19%
+12%
+22%
+240bps
-10%
+28%
Hồ 2023
698
15.3%
106
47
153
(34)
22.1%
119
(3)
116
(89)
27
17.7%
(20)
8
RETAIL
H12022
691
13.2%
92
44
136
(31)
22.8%
105
(3)
101
(83)
18
13.5%
(19)
(1)
YOY CC
-1%
+210bps
+14%
+6%
+11%
+8%
-70bps
+12%
-5%
+13%
+6%
+44%
+400bps
+1%
II.
41View entire presentation