Grab Results Presentation Deck
Outlook
Outlook for 2023
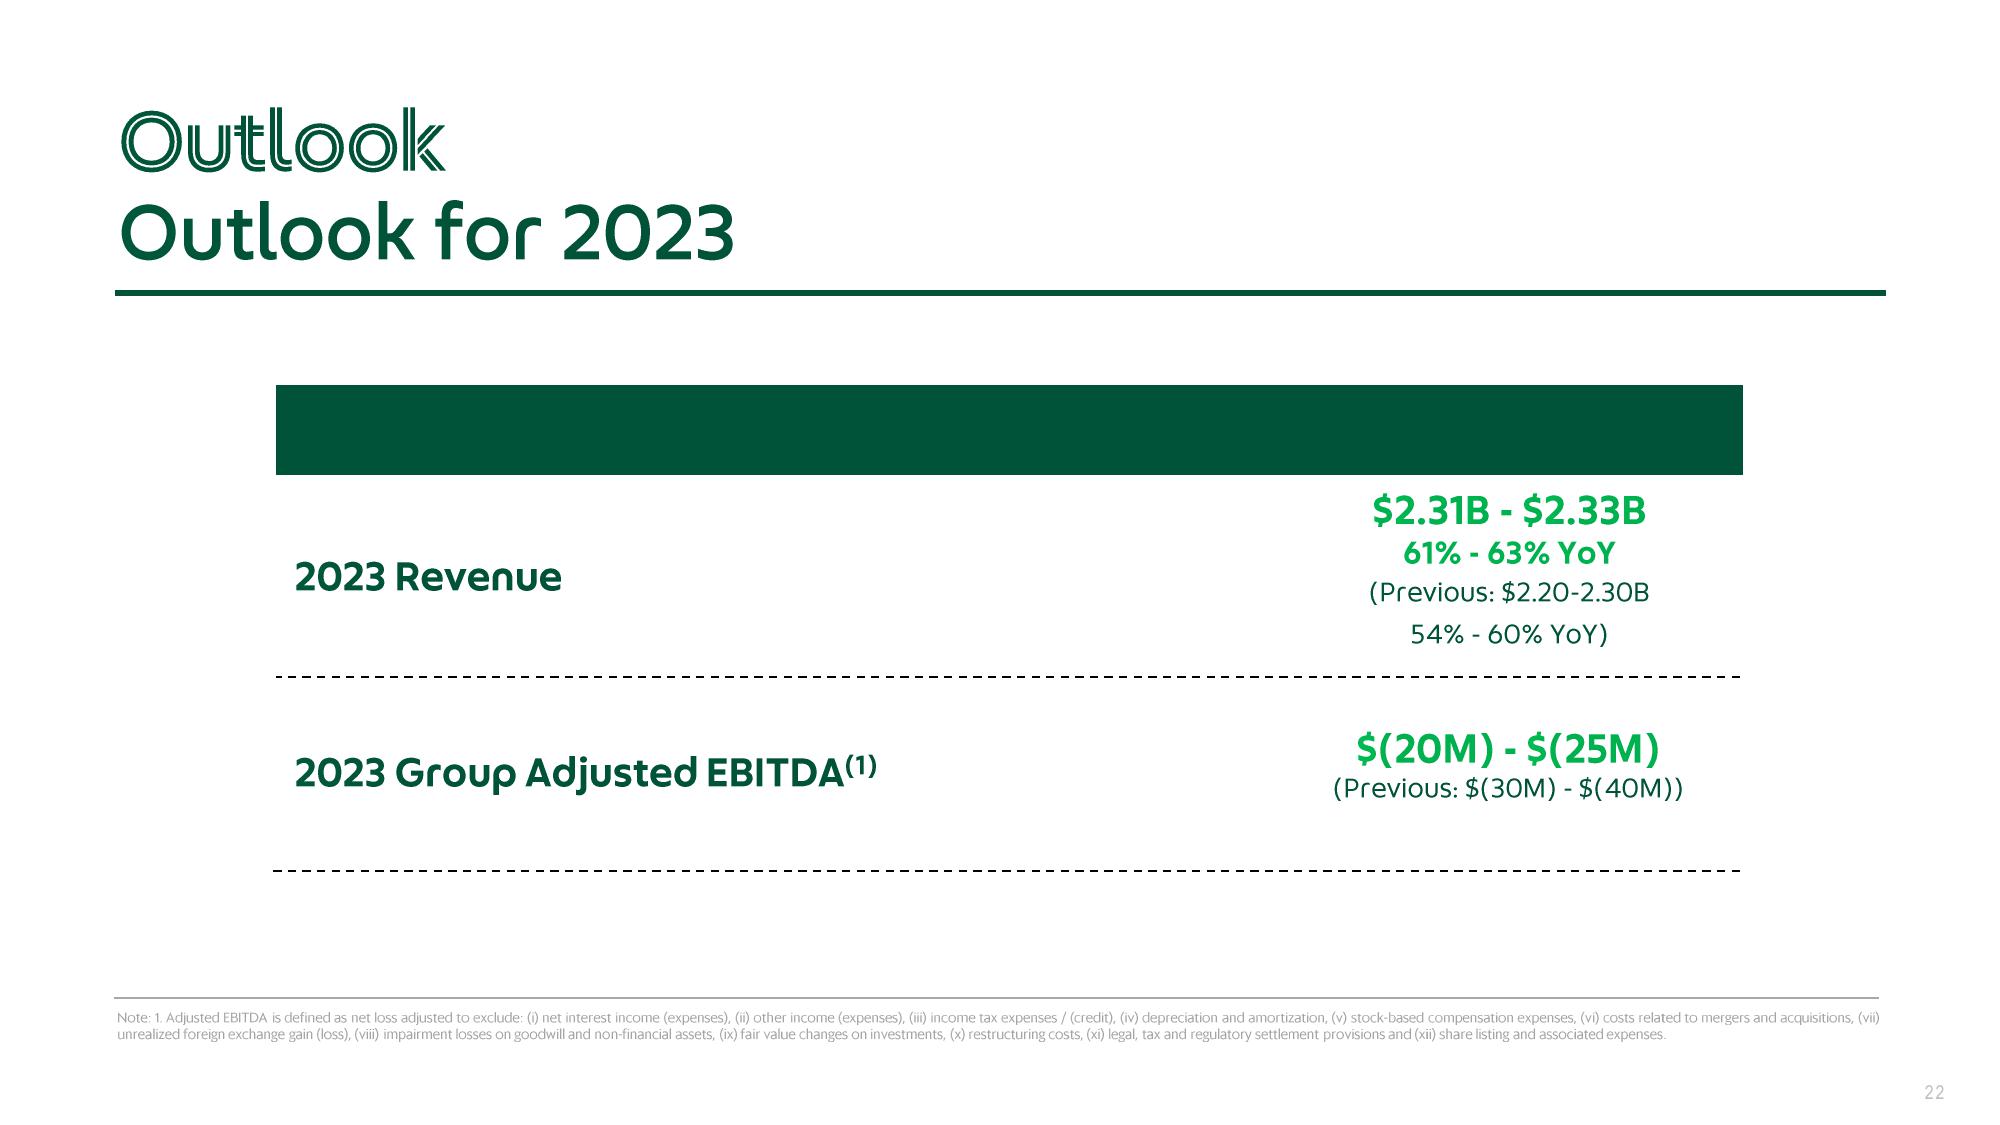
2023 Revenue
2023 Group Adjusted EBITDA(¹)
$2.31B - $2.33B
61% -63% YoY
(Previous: $2.20-2.30B
54% -60% YoY)
$(20M) - $(25M)
(Previous: $(30M) - $(40M))
Note: 1. Adjusted EBITDA is defined as net loss adjusted to exclude: (1) net interest income (expenses), (ii) other income (expenses), (iii) income tax expenses/ (credit), (iv) depreciation and amortization, (v) stock-based compensation expenses, (vi) costs related to mergers and acquisitions, (vii)
unrealized foreign exchange gain (loss), (viii) impairment losses on goodwill and non-financial assets, (ix) fair value changes on investments, (x) restructuring costs, (xi) legal, tax and regulatory settlement provisions and (xii) share listing and associated expenses.
22View entire presentation