Uber Results Presentation Deck
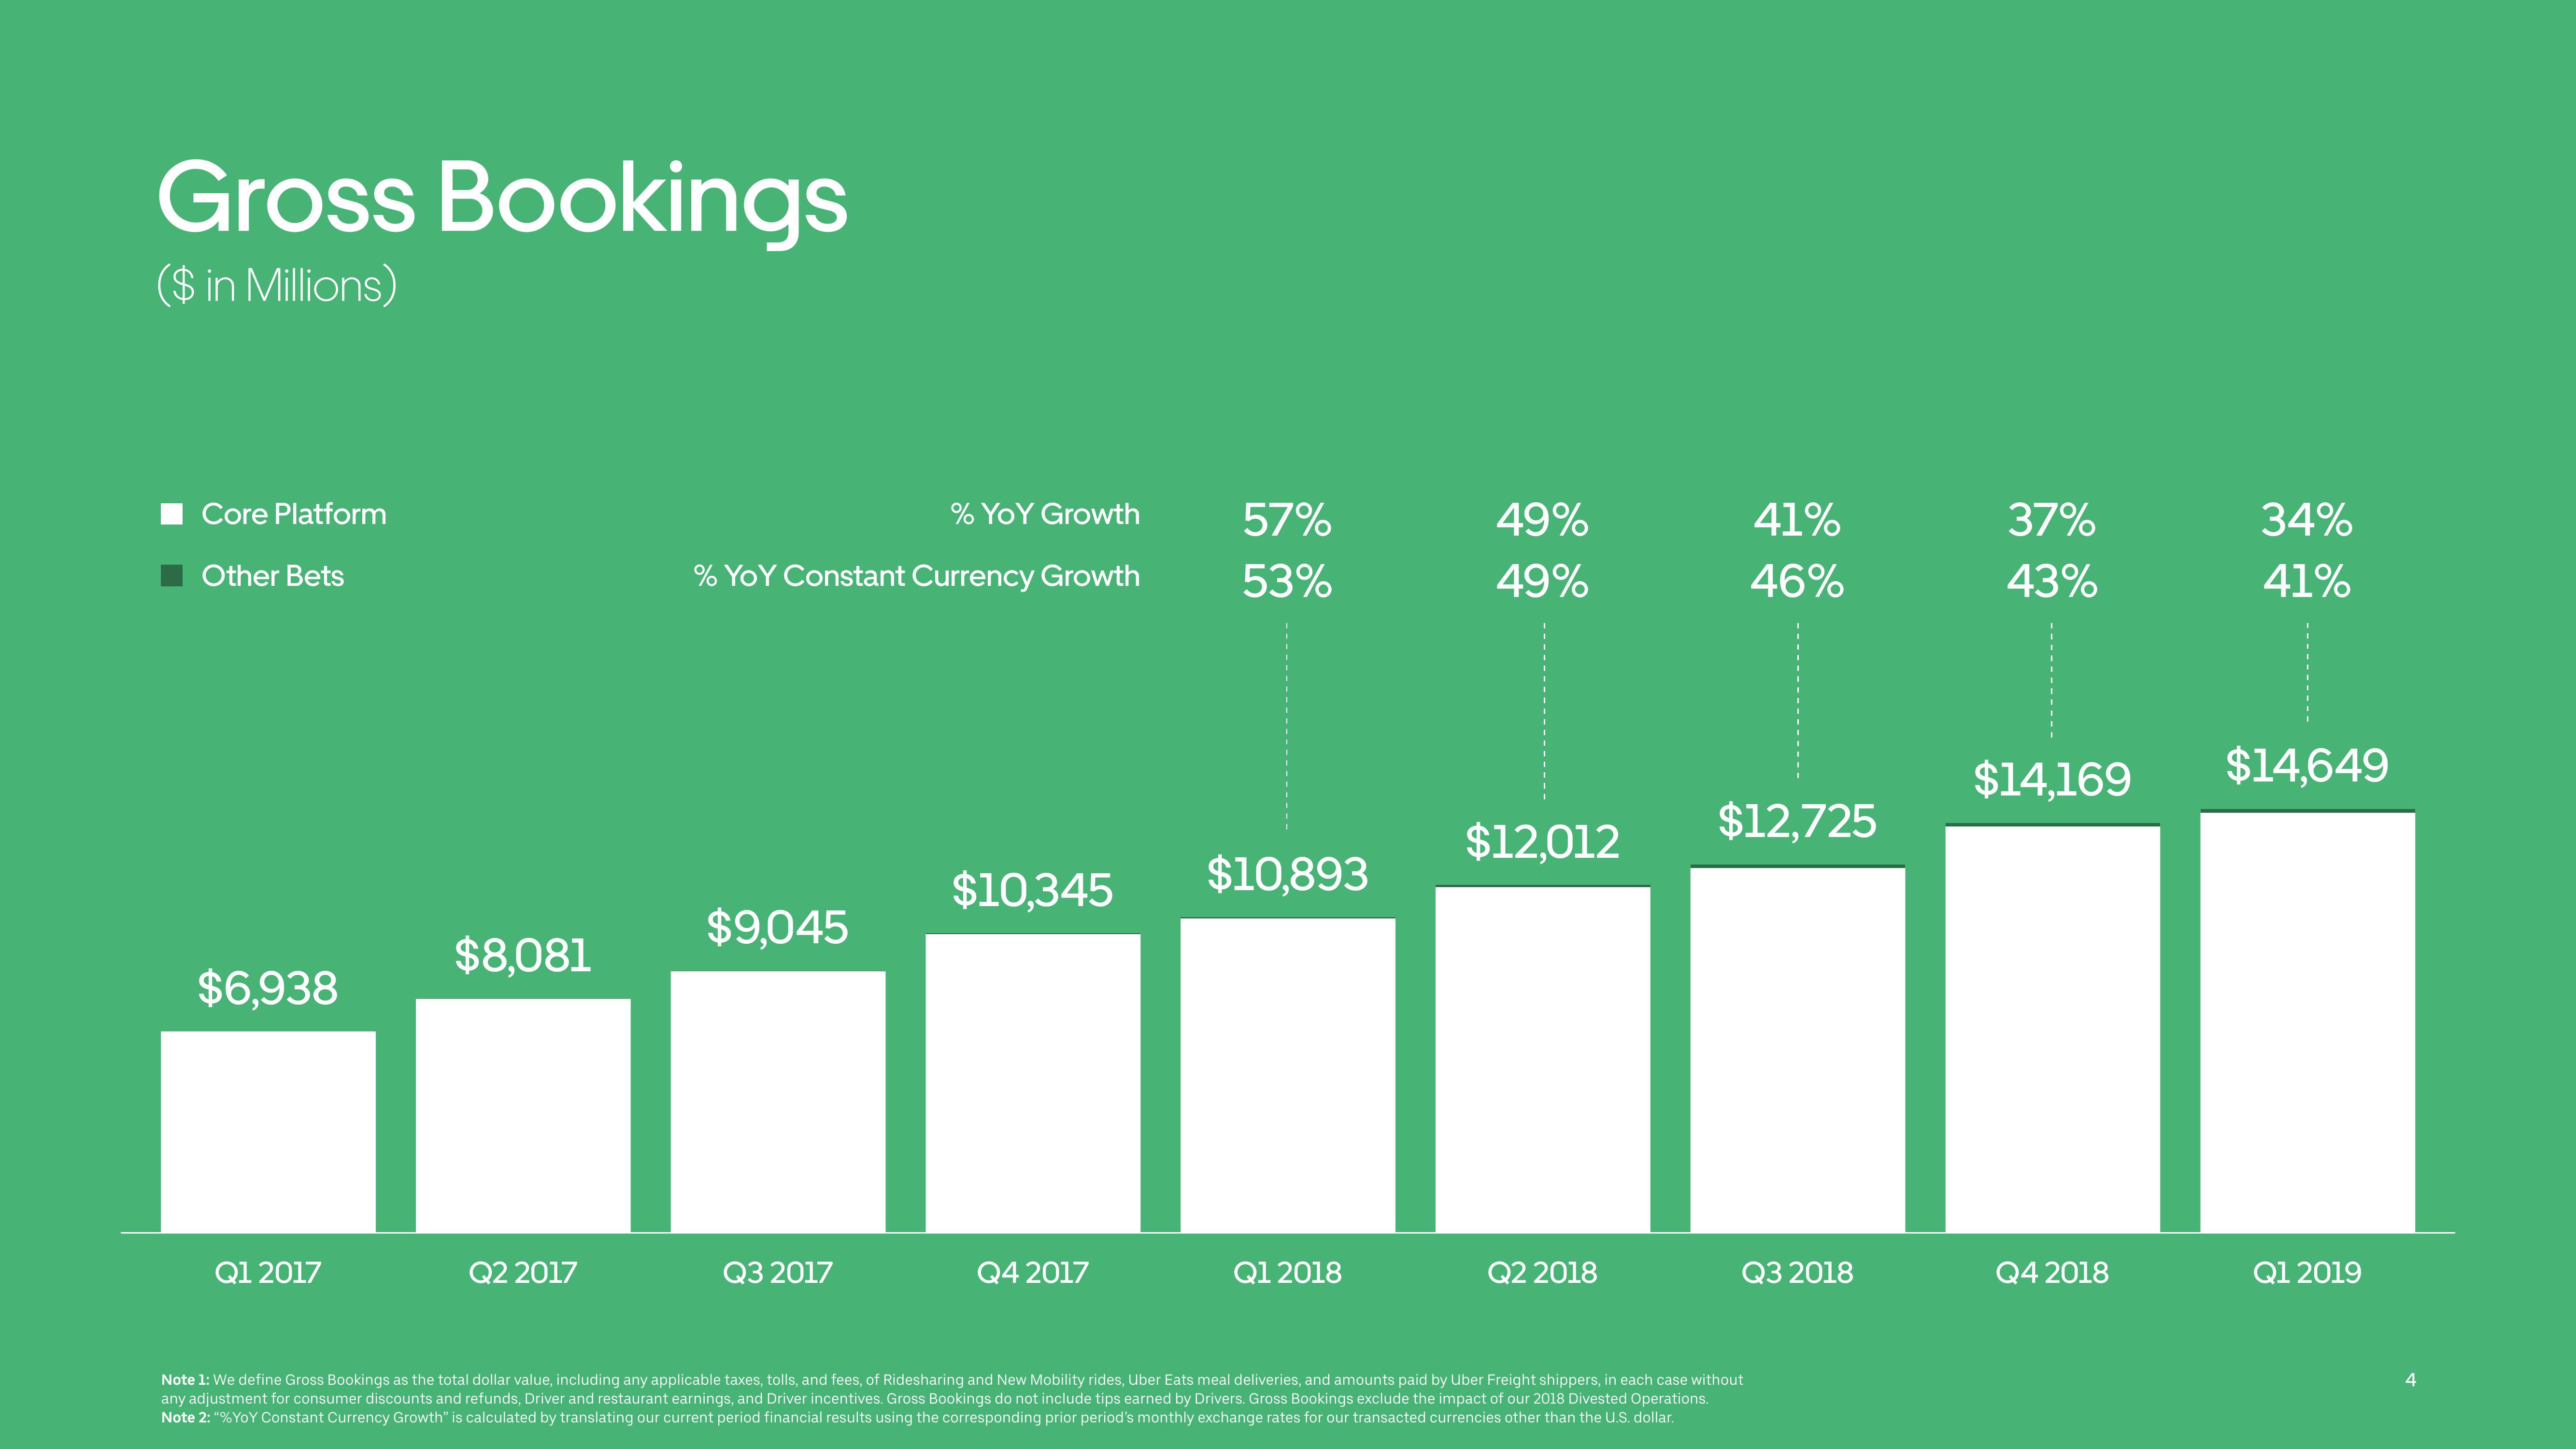
Gross Bookings
($ in Millions)
Core Platform
Other Bets
$6,938
Q1 2017
$8,081
Q2 2017
% YoY Growth
% YoY Constant Currency Growth
$9,045
Q3 2017
$10,345
Q4 2017
57%
53%
$10,893
Q1 2018
49%
49%
$12,012
Q2 2018
41%
46%
$12,725
Q3 2018
Note 1: We define Gross Bookings as the total dollar value, including any applicable taxes, tolls, and fees, of Ridesharing and New Mobility rides, Uber Eats meal deliveries, and amounts paid by Uber Freight shippers, in each case without
any adjustment for consumer discounts and refunds, Driver and restaurant earnings, and Driver incentives. Gross Bookings do not include tips earned by Drivers. Gross Bookings exclude the impact of our 2018 Divested Operations.
Note 2: "%YoY Constant Currency Growth" is calculated by translating our current period financial results using the corresponding prior period's monthly exchange rates for our transacted currencies other than the U.S. dollar.
37%
43%
34%
41%
$14,169 $14,649
Q4 2018
Q1 2019View entire presentation