OpenText Investor Presentation Deck
Return on Invested Capital (ROIC)
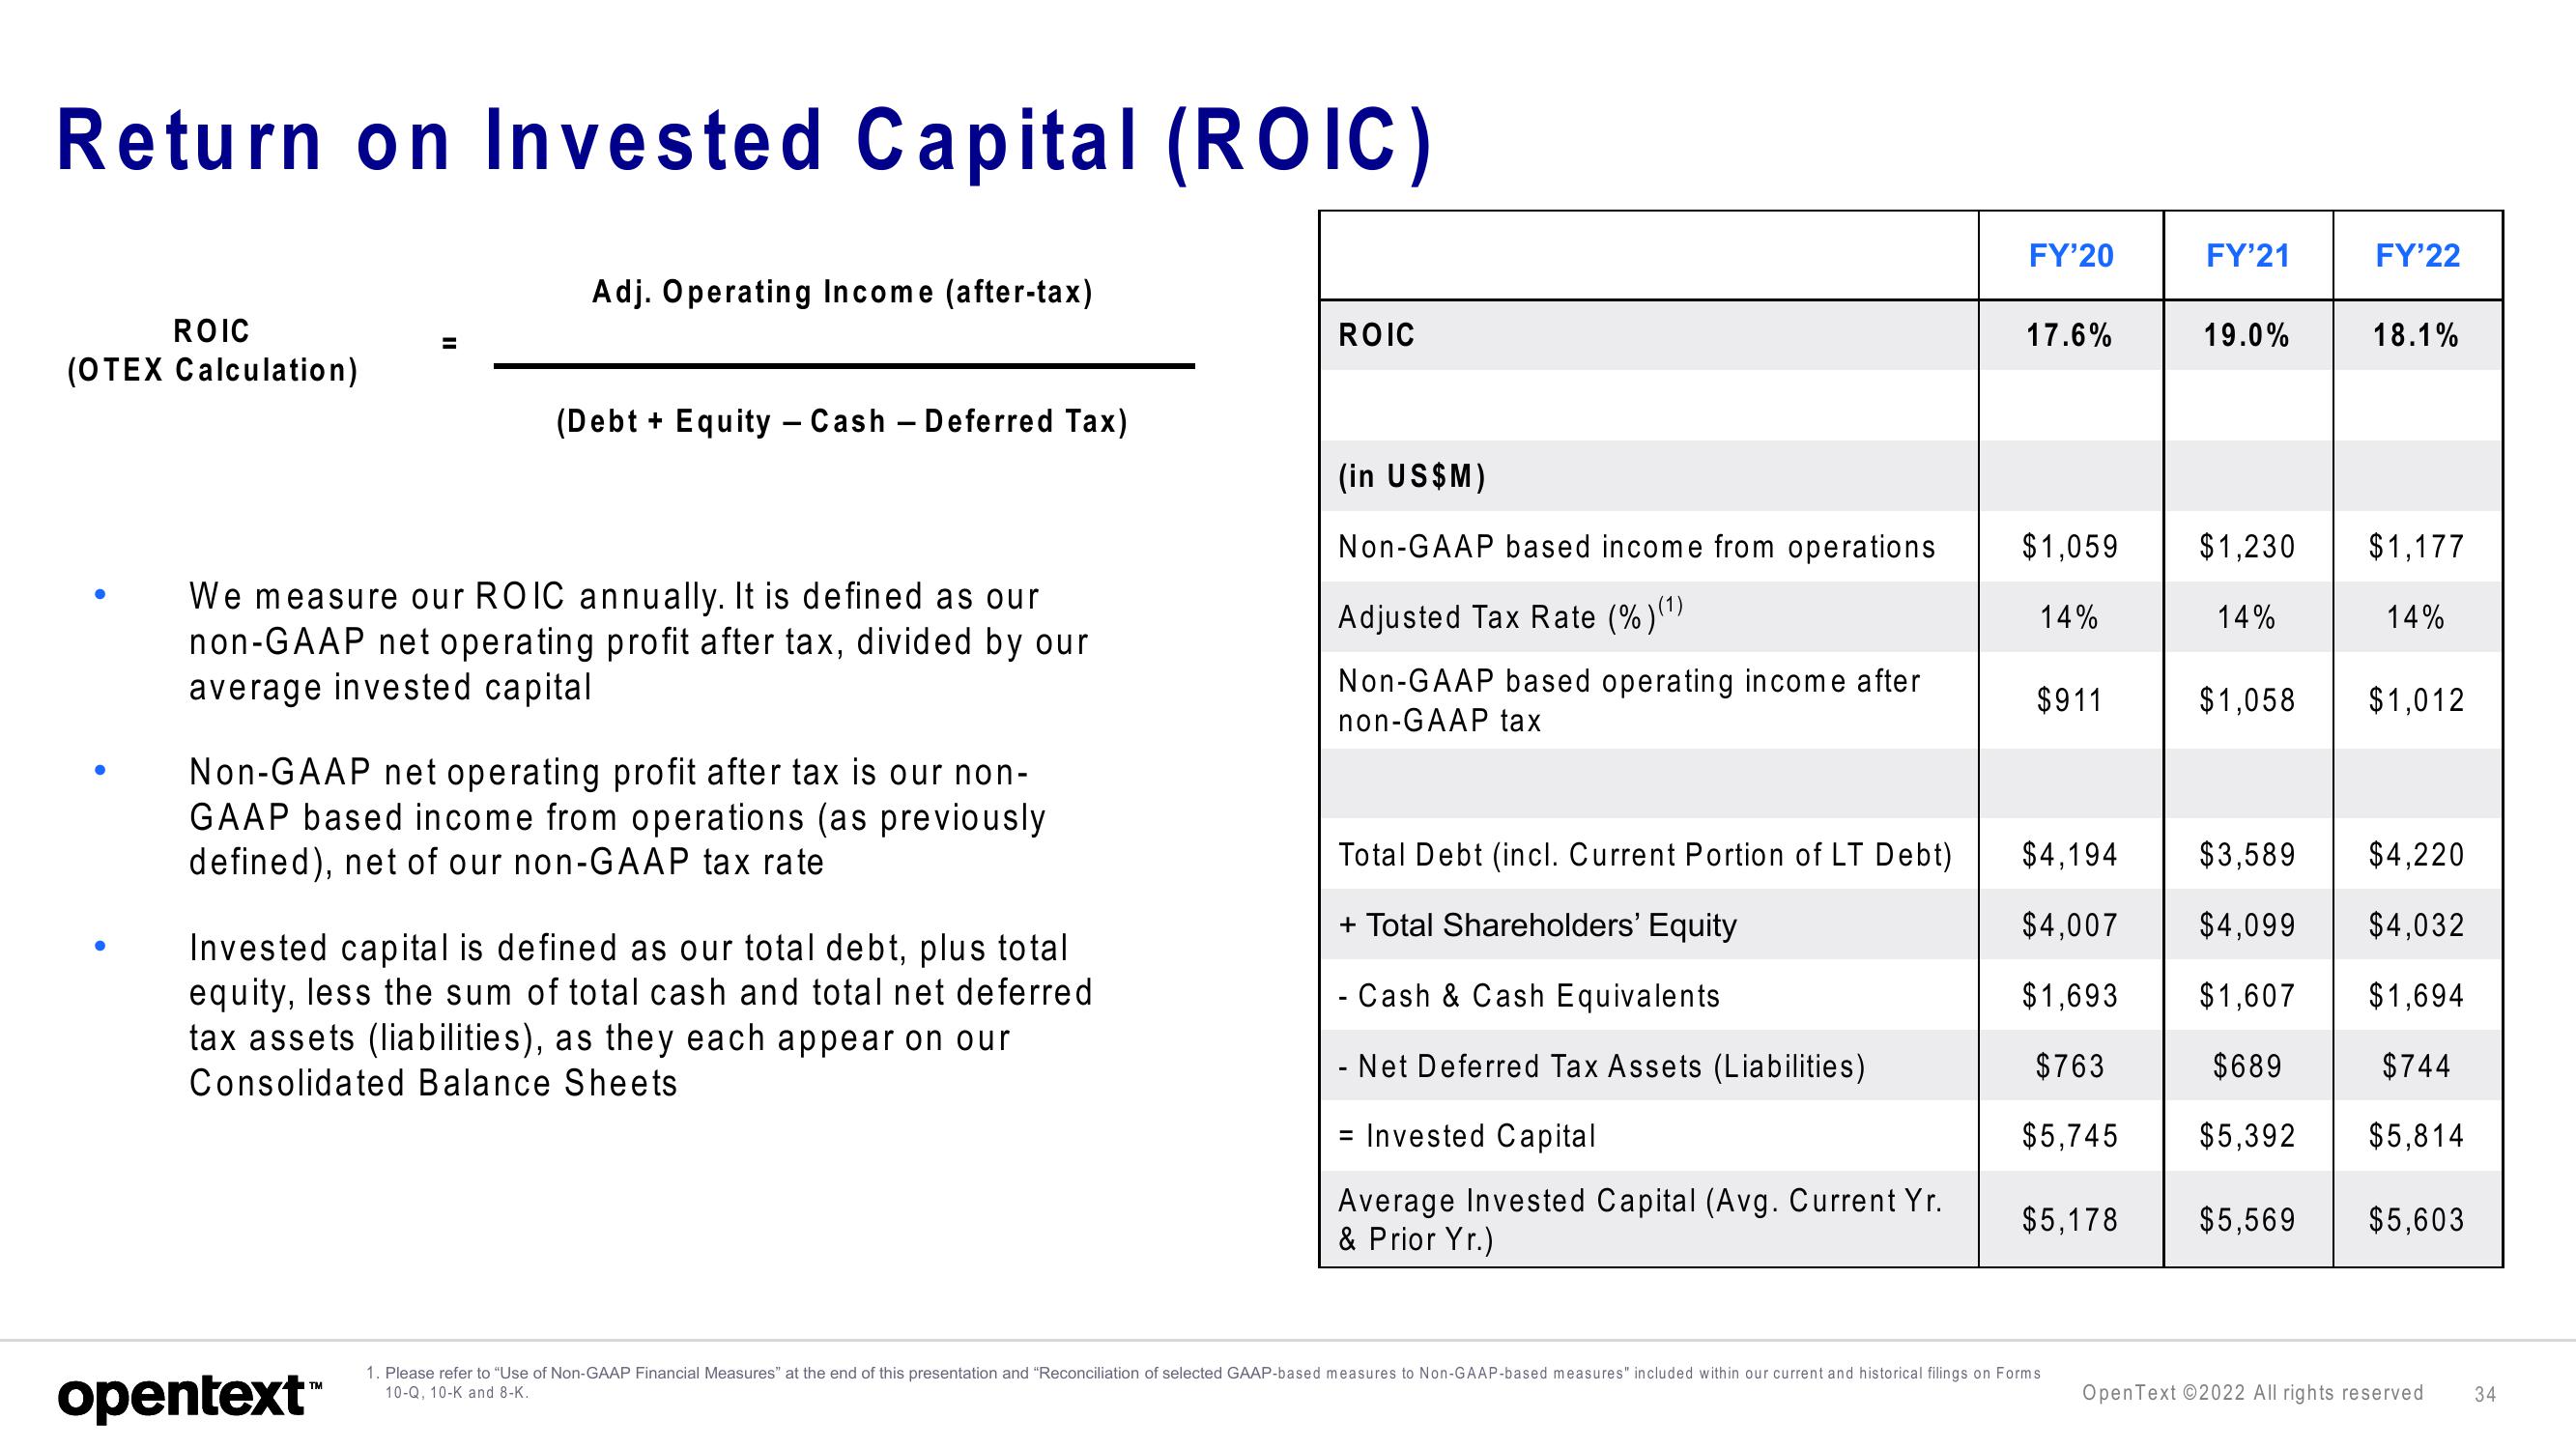
ROIC
(OTEX Calculation)
Adj. Operating Income (after-tax)
(Debt + Equity - Cash Deferred Tax)
We measure our ROIC annually. It is defined as our
non-GAAP net operating profit after tax, divided by our
average invested capital
Non-GAAP net operating profit after tax is our non-
GAAP based income from operations (as previously
defined), net of our non-GAAP tax rate
opentext™
Invested capital is defined as our total debt, plus total
equity, less the sum of total cash and total net deferred
tax assets (liabilities), as they each appear on our
Consolidated Balance Sheets
ROIC
(in US$M)
Non-GAAP based income from operations
Adjusted Tax Rate (%)(¹)
Non-GAAP based operating income after
non-GAAP tax
Total Debt (incl. Current Portion of LT Debt)
+ Total Shareholders' Equity
- Cash & Cash Equivalents
- Net Deferred Tax Assets (Liabilities)
= Invested Capital
Average Invested Capital (Avg. Current Yr.
& Prior Yr.)
FY'20
17.6%
$1,059
14%
$911
FY'21
19.0%
1. Please refer to "Use of Non-GAAP Financial Measures" at the end of this presentation and "Reconciliation of selected GAAP-based measures to Non-GAAP-based measures" included within our current and historical filings on Forms
10-Q, 10-K and 8-K.
$1,230
14%
$1,058
$4,194
$3,589
$4,007
$4,099
$1,693
$1,607
$763
$689
$5,745 $5,392
FY'22
18.1%
$1,177
14%
$1,012
$4,220
$4,032
$1,694
$744
$5,814
$5,178 $5,569 $5,603
OpenText ©2022 All rights reserved 34View entire presentation