TPG Results Presentation Deck
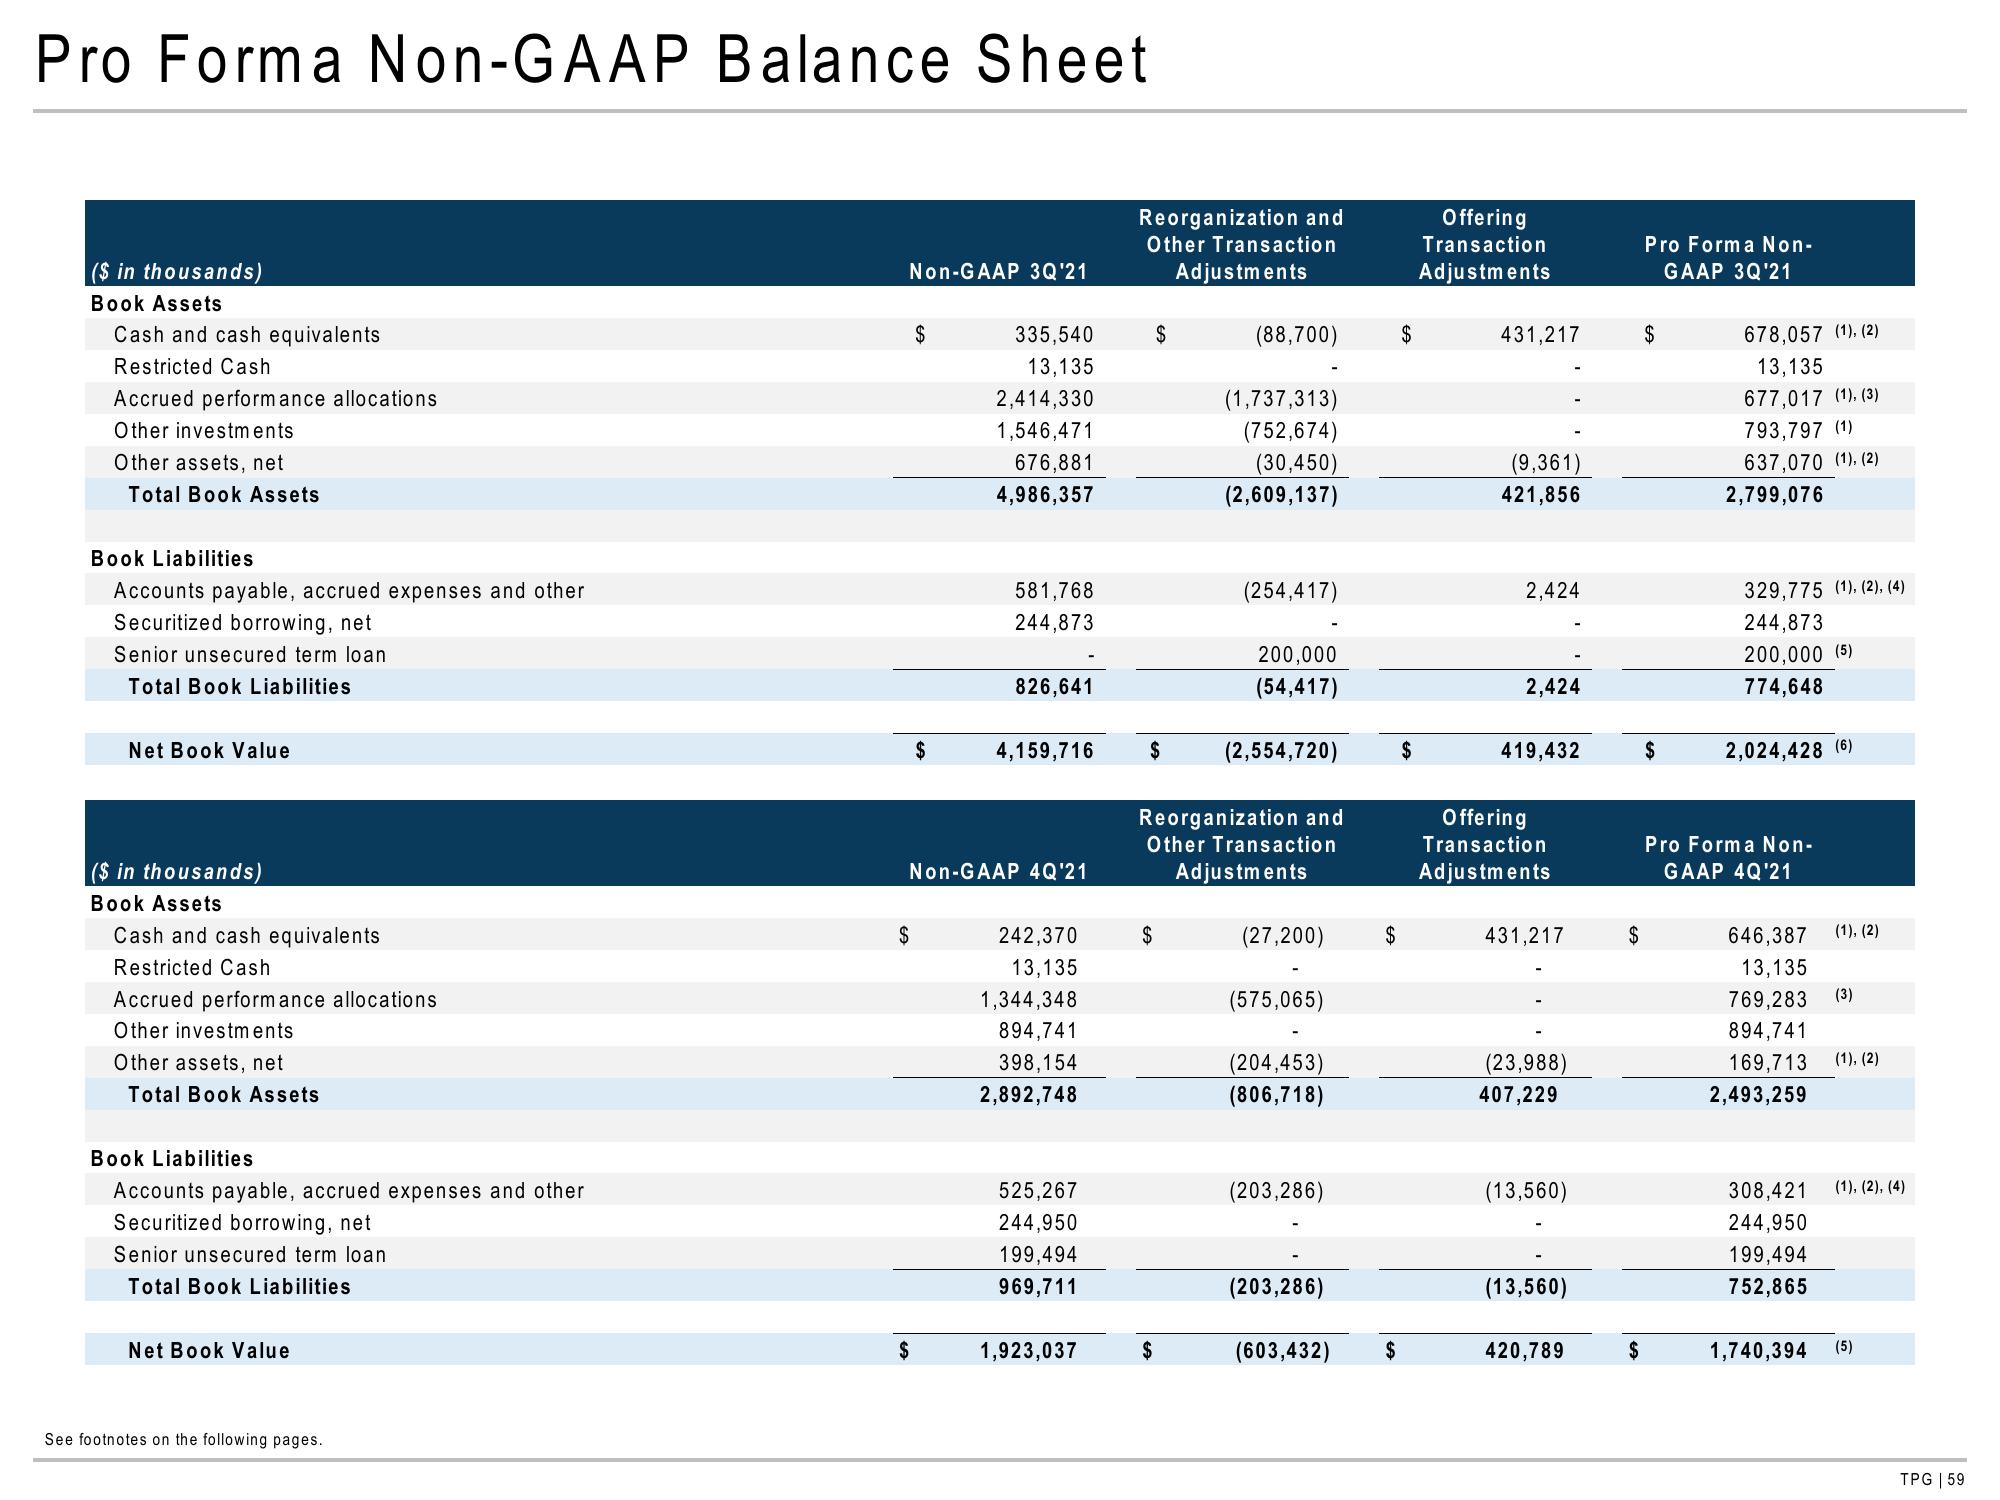
Pro Forma Non-GAAP Balance Sheet
($ in thousands)
Book Assets
Cash and cash equivalents
Restricted Cash
Accrued performance allocations
Other investments.
Other assets, net
Total Book Assets
Book Liabilities
Accounts payable, accrued expenses and other
Securitized borrowing, net
Senior unsecured term loan
Total Book Liabilities.
Net Book Value
($ in thousands)
Book Assets
Cash and cash equivalents
Restricted Cash
Accrued performance allocations
Other investments
Other assets, net
Total Book Assets
Book Liabilities
Accounts payable, accrued expenses and other
Securitized borrowing, net
Senior unsecured term loan
Total Book Liabilities
Net Book Value
See footnotes on the following pages.
Non-GAAP 3Q'21
$
$
$
$
335,540
13,135
2,414,330
1,546,471
,881
4,986,357
581,768
244,873
826,641
Non-GAAP 4Q'21
4,159,716
242,370
13,135
1,344,348
894,741
398,154
2,892,748
525,267
244,950
199,494
969,711
1,923,037
Reorganization and
Other Transaction
Adjustments
$
$
$
$
(88,700)
(1,737,313)
(752,674)
(30,450)
(2,609,137)
(254,417)
200,000
(54,417)
Reorganization and
Other Transaction
Adjustments
(2,554,720)
(27,200)
(575,065)
(204,453)
(806,718)
(203,286)
(203,286)
(603,432)
$
$
$
$
Offering
Transaction
Adjustments
431,217
(9,361)
421,856
2,424
2,424
419,432
Offering
Transaction
Adjustments
431,217
(23,988)
407,229
(13,560)
(13,560)
420,789
$
$
Pro Forma Non-
GAAP 3Q'21
$
$
678,057 (1), (2)
13,135
677,017 (1), (3)
793,797 (1)
7,07
(1), (2)
2,799,076
329,775 (1), (2), (4)
244,873
200,000 (5)
774,648
2,024,428 (6)
Pro Forma Non-
GAAP 4Q'21
646,387 (1), (2)
13,135
769,283 (3)
894,741
169,713 (1), (2)
2,493,259
308,421
244,950
199,494
752,865
1,740,394
(1), (2), (4)
(5)
TPG | 59View entire presentation