Kore Results Presentation Deck
Summary - FY 2022 Earnings & 2023 Outlook
8
●
●
●
●
●
●
●
FY 2022 vs. FY 2021
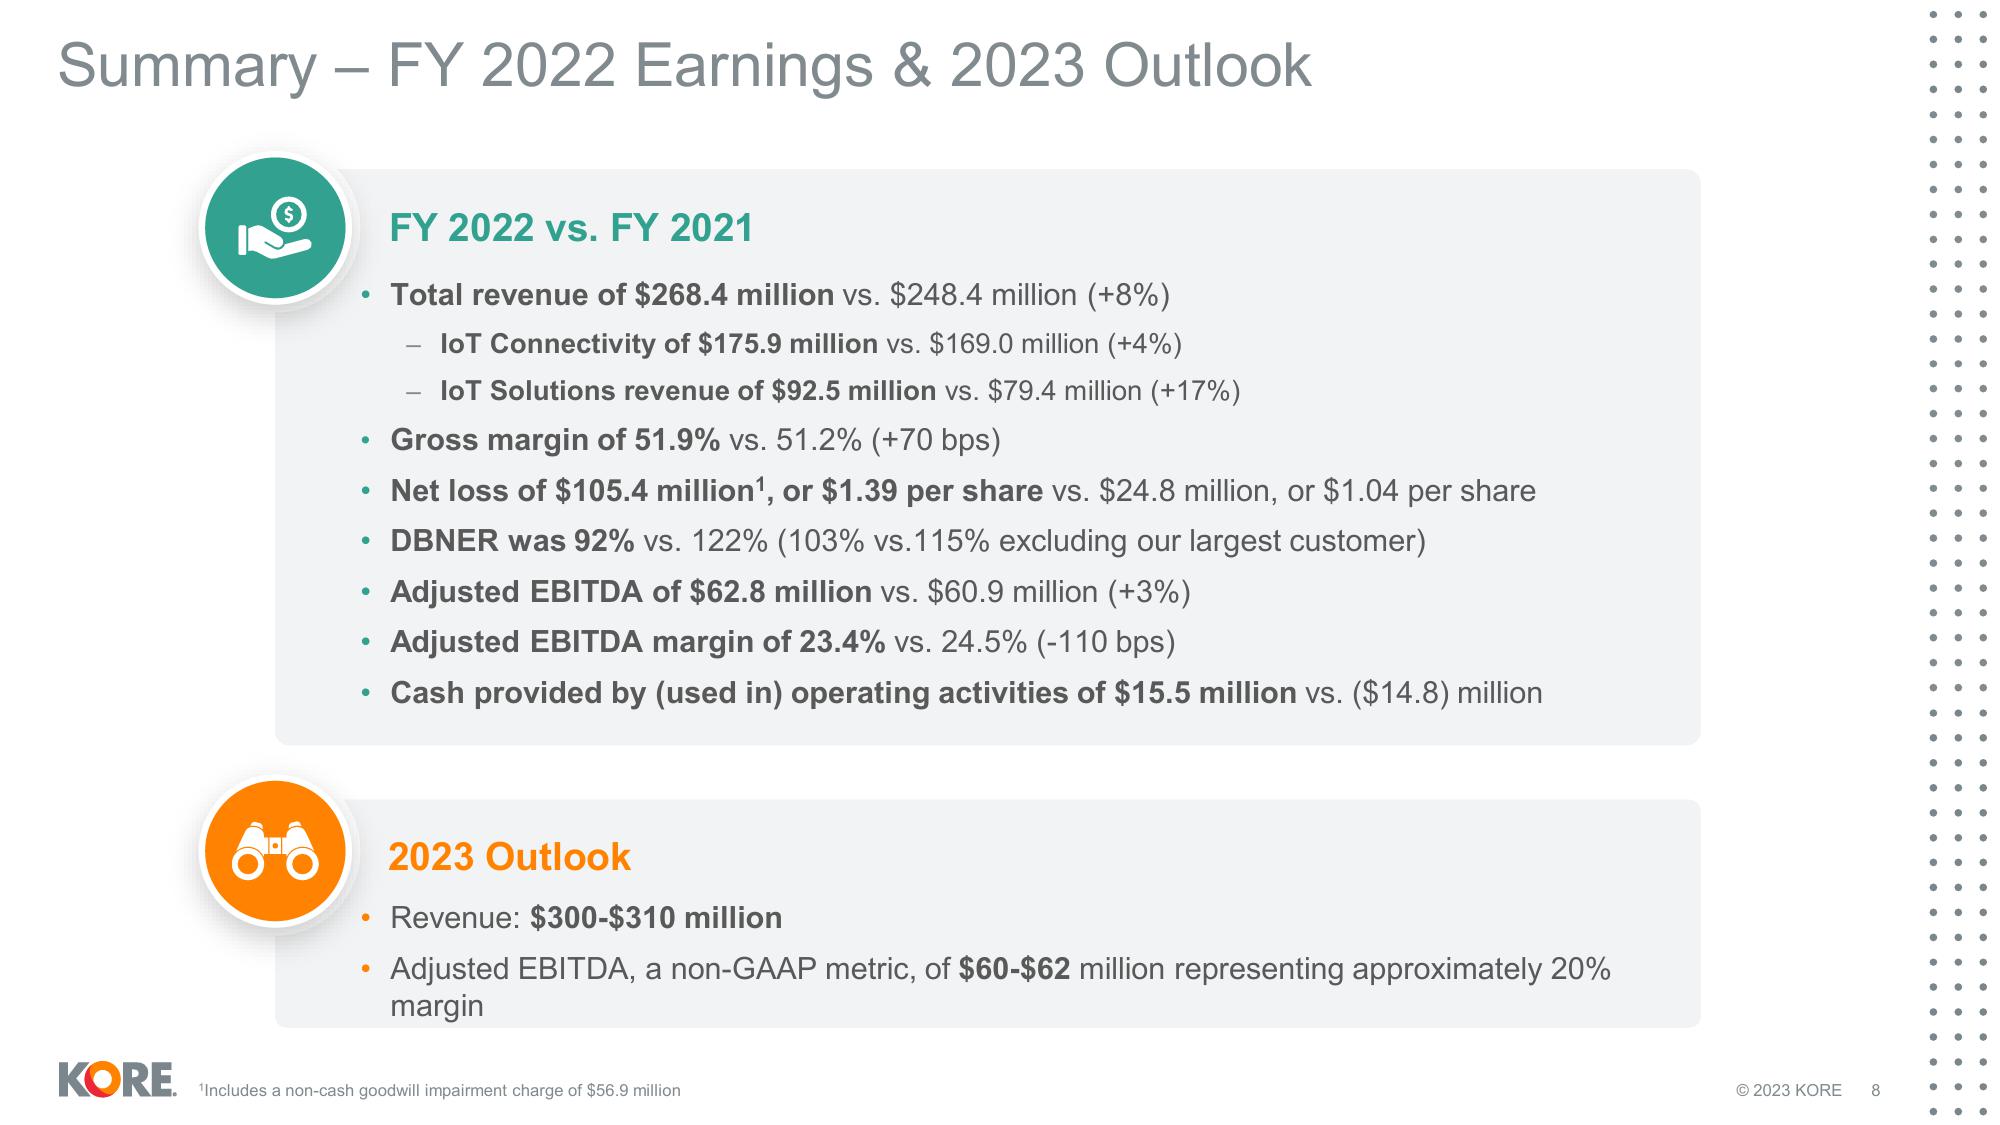
Total revenue of $268.4 million vs. $248.4 million (+8%)
IoT Connectivity of $175.9 million vs. $169.0 million (+4%)
loT Solutions revenue of $92.5 million vs. $79.4 million (+17%)
Gross margin of 51.9% vs. 51.2% (+70 bps)
Net loss of $105.4 million¹, or $1.39 per share vs. $24.8 million, or $1.04 per share
DBNER was 92% vs. 122% (103% vs.115% excluding our largest customer)
Adjusted EBITDA of $62.8 million vs. $60.9 million (+3%)
Adjusted EBITDA margin of 23.4% vs. 24.5% (-110 bps)
Cash provided by (used in) operating activities of $15.5 million vs. ($14.8) million
2023 Outlook
Revenue: $300-$310 million
Adjusted EBITDA, a non-GAAP metric, of $60-$62 million representing approximately 20%
margin
KORE ¹Includes a non-cash goodwill impairment charge of $56.9 million
© 2023 KORE
8
●
●
●
●
●
●
●
● ●
●
●
●
..
●
●●
●
●
● ●
●
.
● ●
●
●
●
● ●
●
●
•
● ●
●
e
●
●View entire presentation