Pershing Square Activist Presentation Deck
Recent Financial Performance
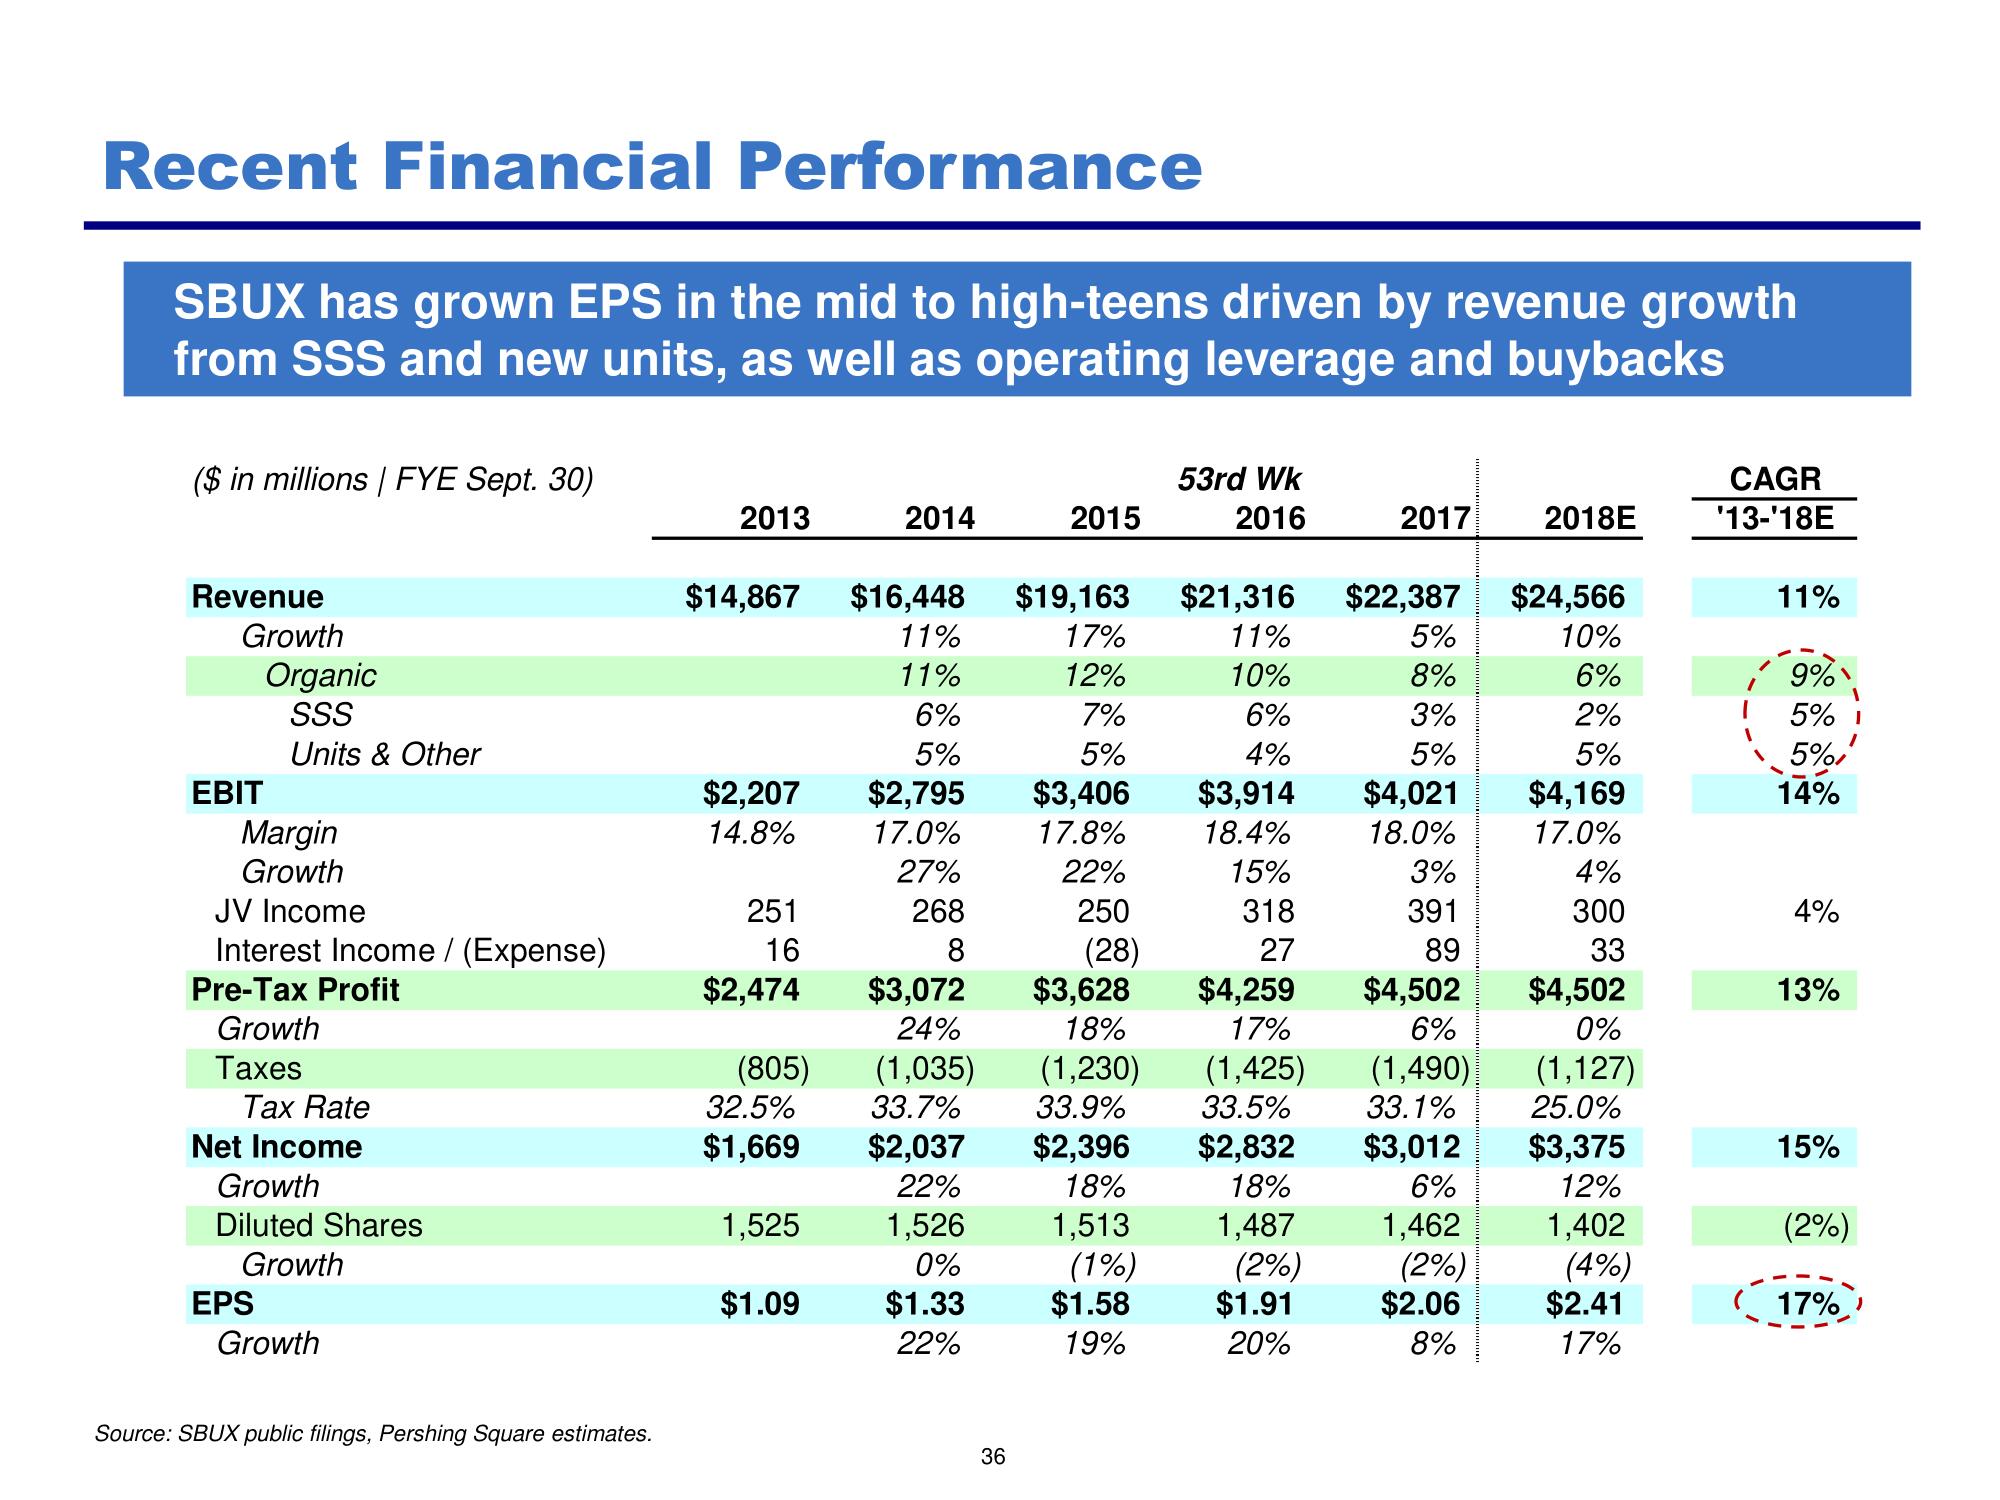
SBUX has grown EPS in the mid to high-teens driven by revenue growth
from SSS and new units, as well as operating leverage and buybacks
($ in millions | FYE Sept. 30)
Revenue
Growth
EBIT
Organic
SSS
Units & Other
Margin
Growth
JV Income
Interest Income / (Expense)
Pre-Tax Profit
Growth
Taxes
Tax Rate
Net Income
Growth
Diluted Shares
Growth
EPS
Growth
Source: SBUX public filings, Pershing Square estimates.
2013
$2,207
14.8%
251
16
$2,474
$14,867 $16,448 $19,163 $21,316
11%
17%
11%
11%
12%
10%
6%
7%
6%
5%
5%
4%
(805)
32.5%
$1,669
1,525
2014
$1.09
$2,795
17.0%
27%
268
8
$3,072
24%
(1,035)
33.7%
$2,037
22%
1,526
0%
$1.33
22%
2015
36
$3,406
17.8%
22%
250
(28)
$3,628
18%
(1,230)
33.9%
$2,396
18%
1,513
53rd Wk
2016
(1%)
$1.58
19%
$3,914
18.4%
15%
318
27
$4,259
17%
(1,425)
33.5%
$2,832
18%
1,487
(2%)
$1.91
20%
2017
$22,387 $24,566
10%
6%
2%
5%
5%
8%
3%
5%
$4,021
18.0%
3%
391
89
2018E
$2.06
8%
$4,169
17.0%
4%
300
33
$4,502
$4,502
6%
0%
(1,490)
(1,127)
33.1%
25.0%
$3,012 $3,375
6%
12%
1,462
1,402
(2%)
(4%)
$2.41
17%
CAGR
'13-'18E
1
"
11%
9%
5%
5%
14%
4%
13%
15%
1
(2%)
17%View entire presentation