AvePoint Investor Presentation Deck slide image

AvePoint Investor Presentation Deck

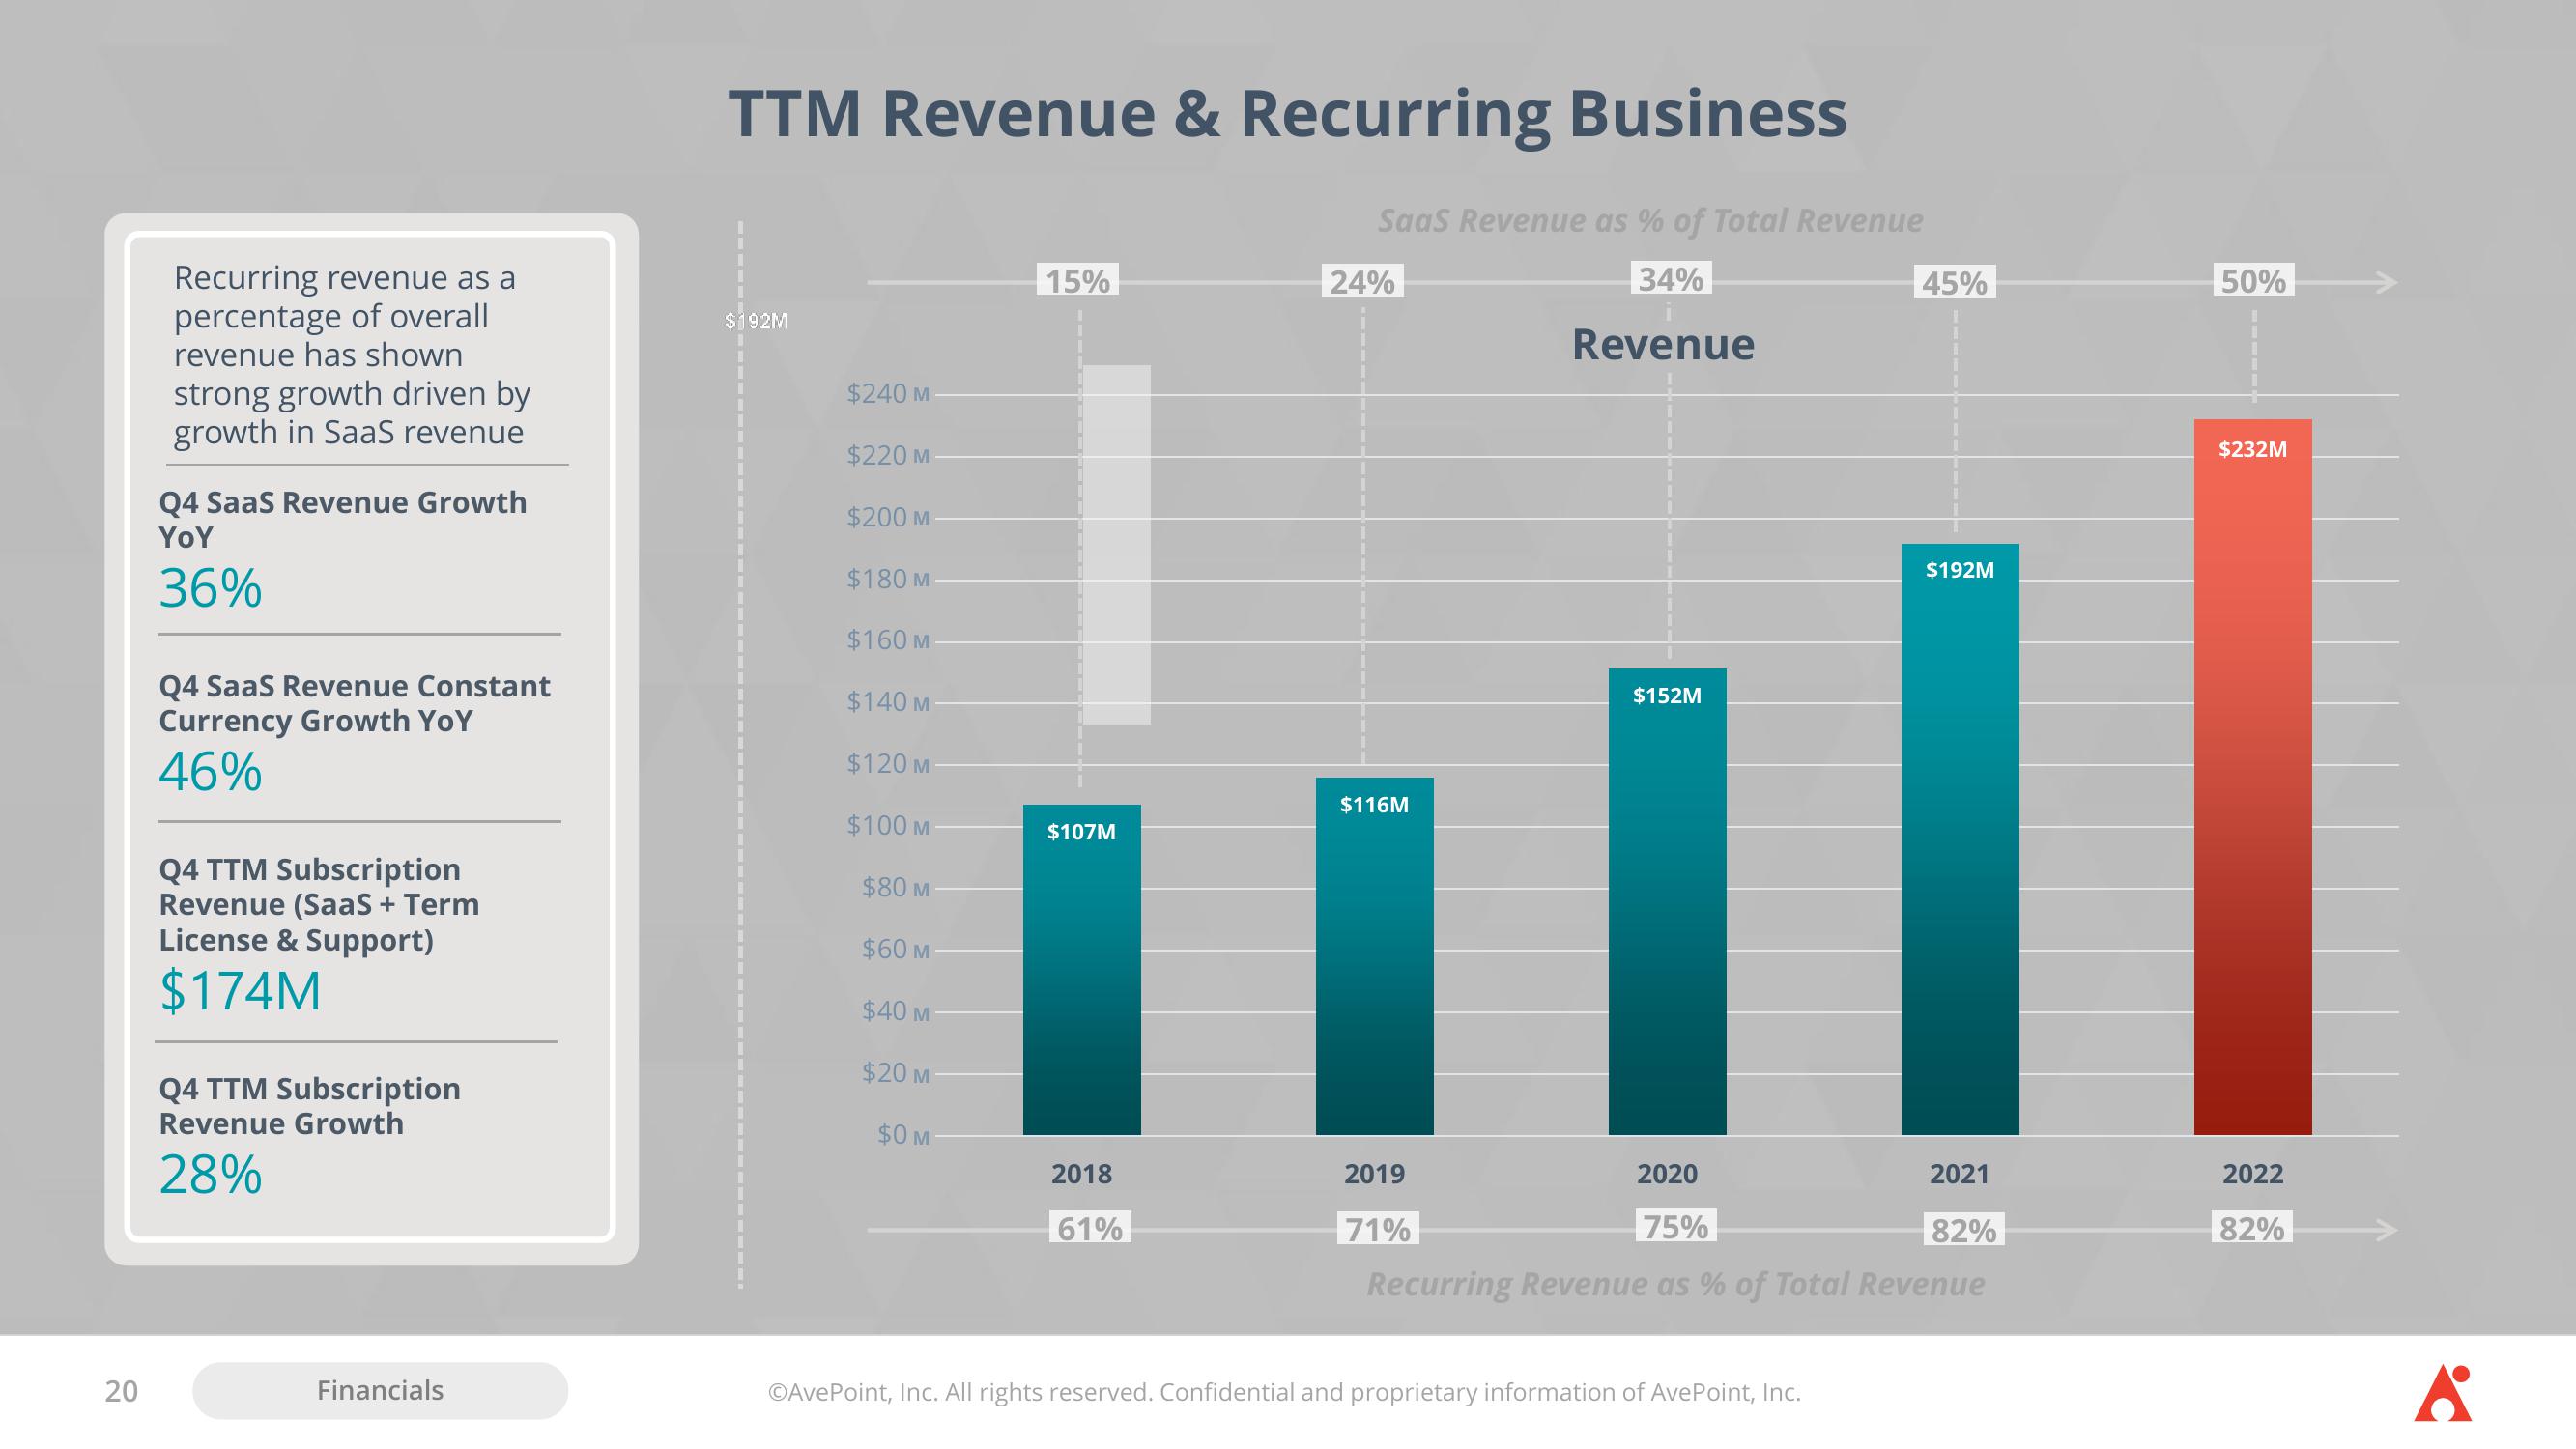
20 Recurring revenue as a percentage of overall revenue has shown strong growth driven by growth in SaaS revenue Q4 SaaS Revenue Growth YoY 36% Q4 SaaS Revenue Constant Currency Growth YoY 46% Q4 TTM Subscription Revenue (SaaS + Term License & Support) $174M Q4 TTM Subscription Revenue Growth 28% Financials TTM Revenue & Recurring Business $192M $240 M $220 M $200 M $180 M $160 M $140 M $120 M $100 M $80 M $60 M $40 M $20 M $0 M 15% $107M 2018 61% SaaS Revenue as % of Total Revenue 34% Revenue 24% $116M $152M 2019 71% 45% 2020 75% Recurring Revenue as % of Total Revenue â’¸AvePoint, Inc. All rights reserved. Confidential and proprietary information of AvePoint, Inc. $192M 2021 82% 50% $232M 2022 82% 6
View entire presentation