SoftBank Results Presentation Deck
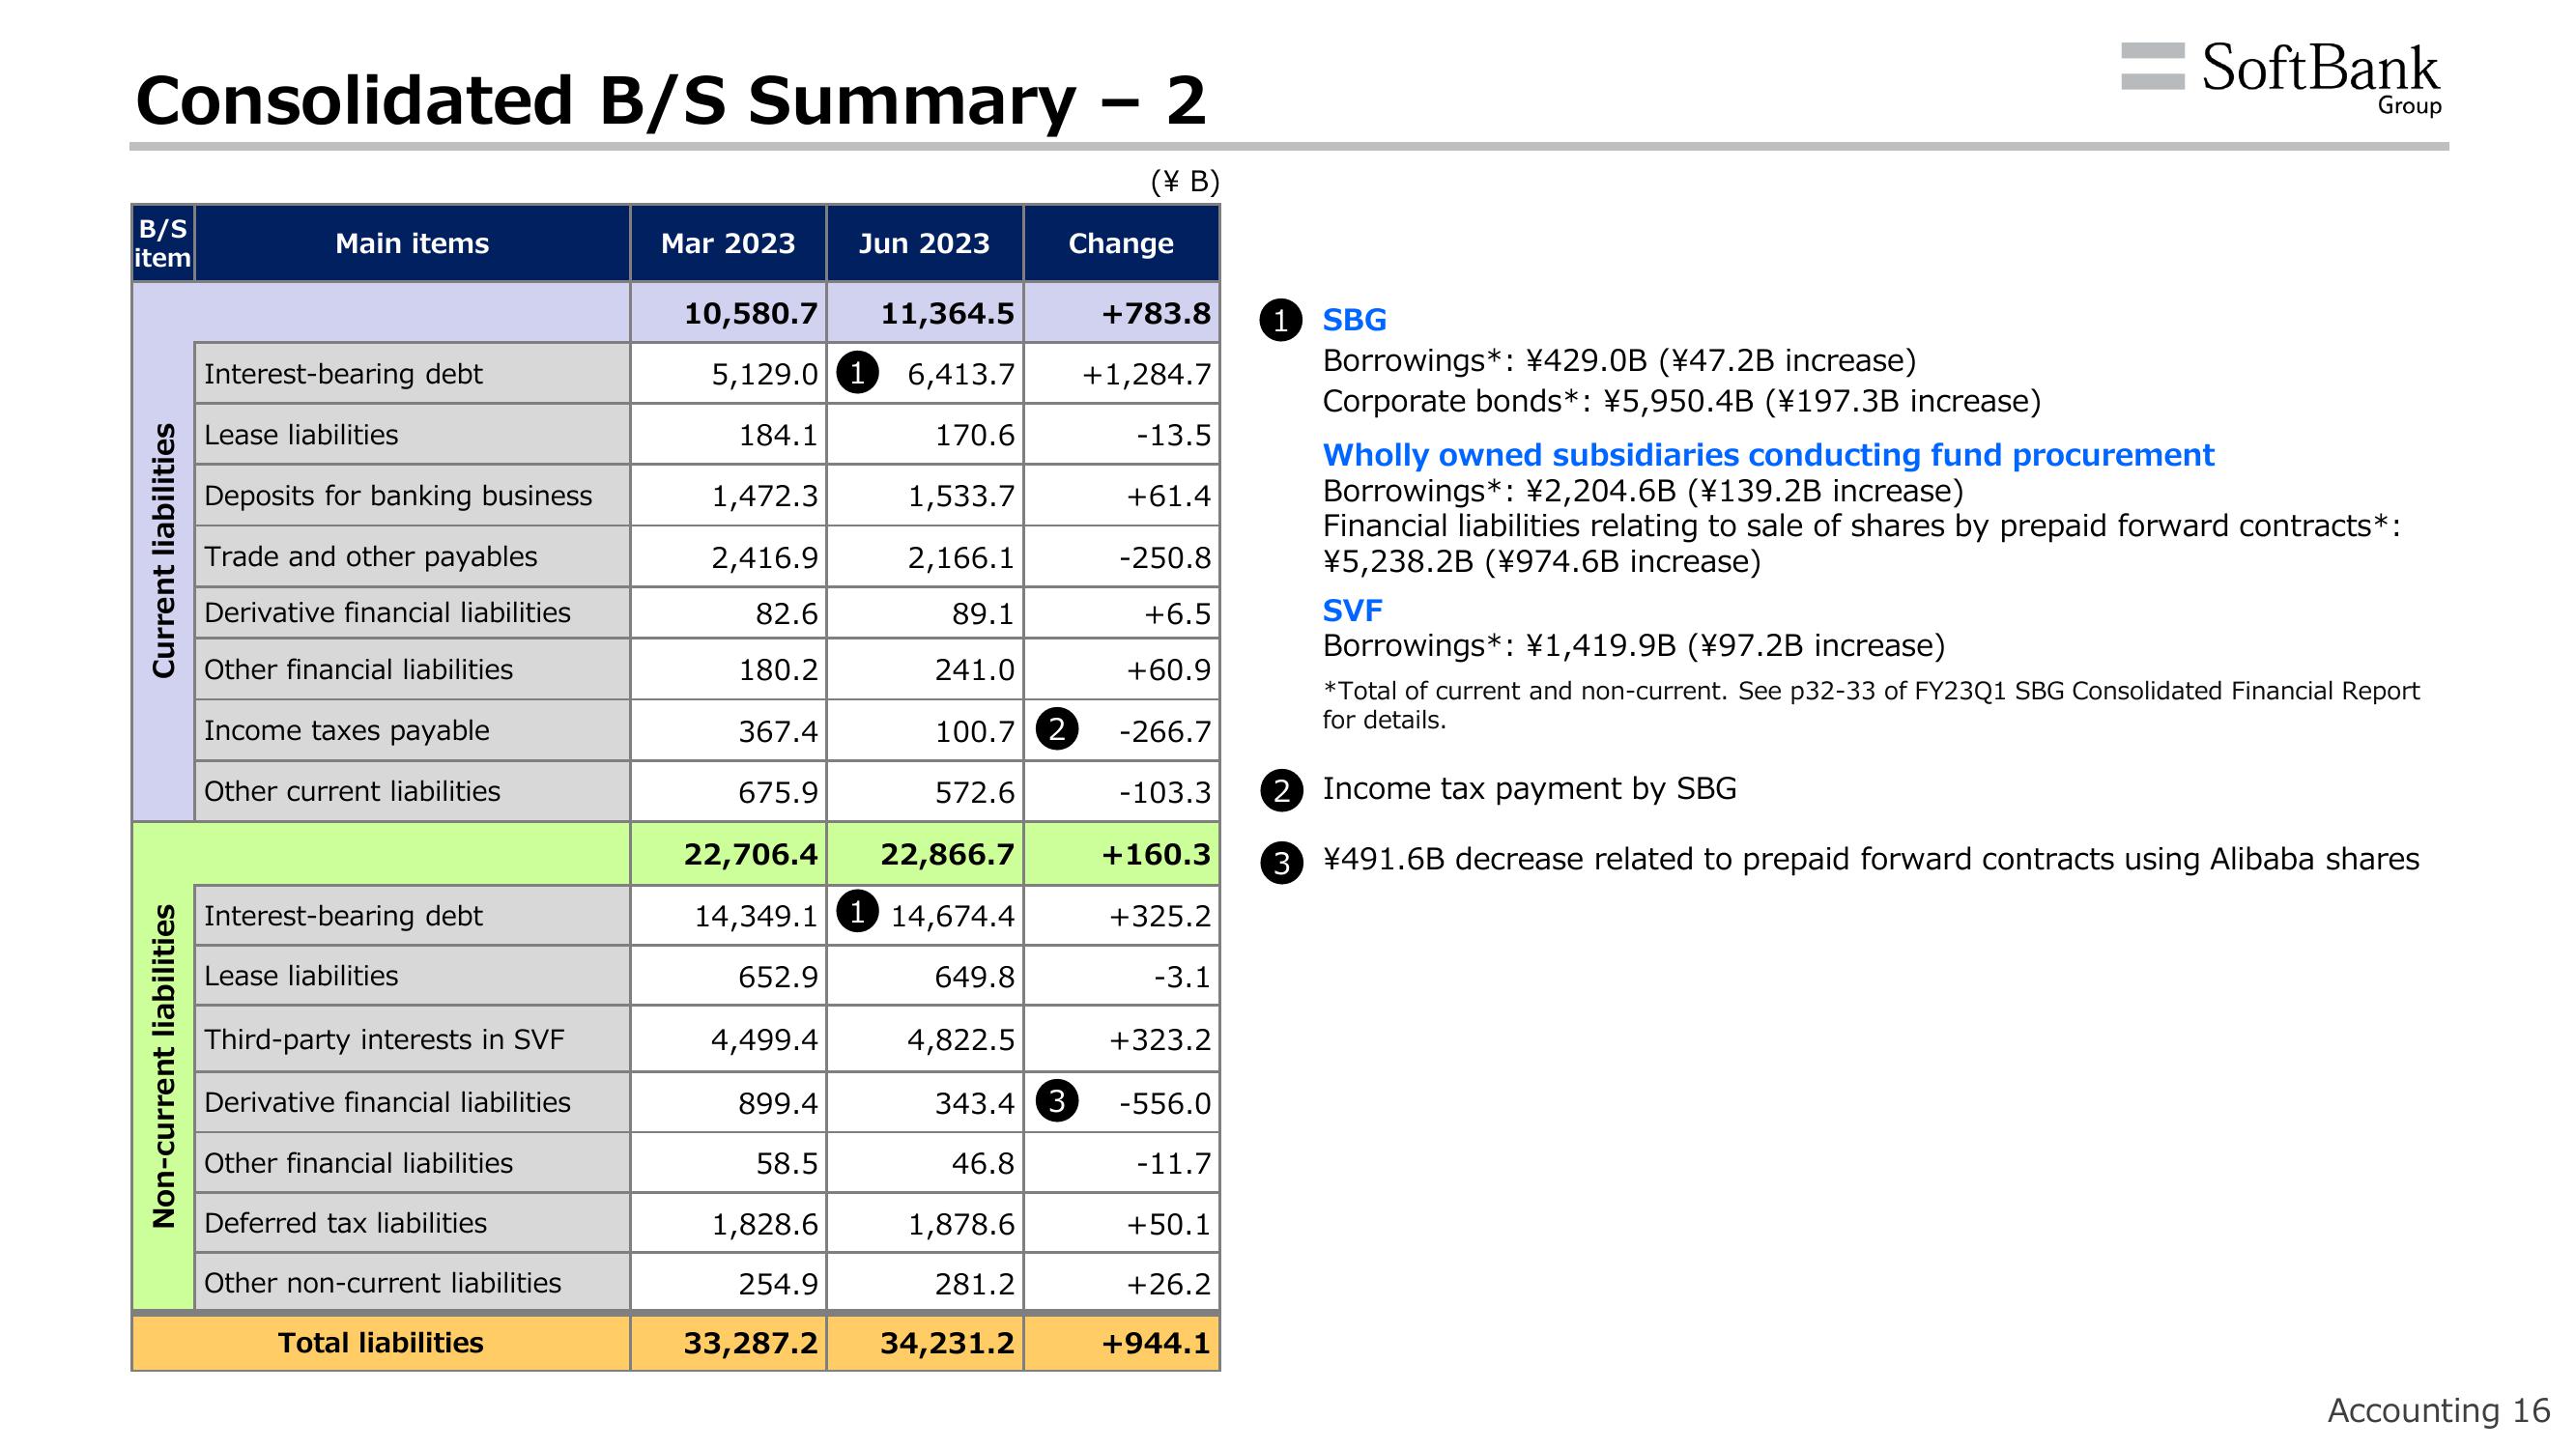
Consolidated B/S Summary - 2
(\ B)
B/S
item
Current liabilities
Non-current liabilities
Main items
Interest-bearing debt
Lease liabilities
Deposits for banking business
Trade and other payables
Derivative financial liabilities
Other financial liabilities
Income taxes payable
Other current liabilities
Interest-bearing debt
Lease liabilities
Third-party interests in SVF
Derivative financial liabilities
Other financial liabilities
Deferred tax liabilities
Other non-current liabilities
Total liabilities
Mar 2023
1,472.3
2,416.9
82.6
180.2
367.4
675.9
10,580.7 11,364.5
+783.8
5,129.01 6,413.7
+1,284.7
184.1
170.6
-13.5
1,533.7
+61.4
2,166.1
-250.8
89.1
+6.5
241.0
+60.9
100.7 2 -266.7
572.6
-103.3
22,706.4 22,866.7
14,349.1 1 14,674.4
652.9
649.8
4,822.5
4,499.4
899.4
58.5
Jun 2023
1,828.6
254.9
33,287.2
Change
1,878.6
281.2
34,231.2
+160.3
+325.2
-3.1
343.4 3 -556.0
46.8
-11.7
+323.2
+50.1
+26.2
+944.1
1 SBG
= SoftBank
Group
Borrowings*: ¥429.0B (¥47.2B increase)
Corporate bonds*: ¥5,950.4B (¥197.3B increase)
Wholly owned subsidiaries conducting fund procurement
Borrowings*: ¥2,204.6B (¥139.2B increase)
Financial liabilities relating to sale of shares by prepaid forward contracts*:
¥5,238.2B (¥974.6B increase)
SVF
Borrowings*: ¥1,419.9B (¥97.2B increase)
*Total of current and non-current. See p32-33 of FY23Q1 SBG Consolidated Financial Report
for details.
2 Income tax payment by SBG
3 ¥491.6B decrease related to prepaid forward contracts using Alibaba shares
Accounting 16View entire presentation