Grab Results Presentation Deck
2021 Q1 Results
Consolidated Group (Cont)
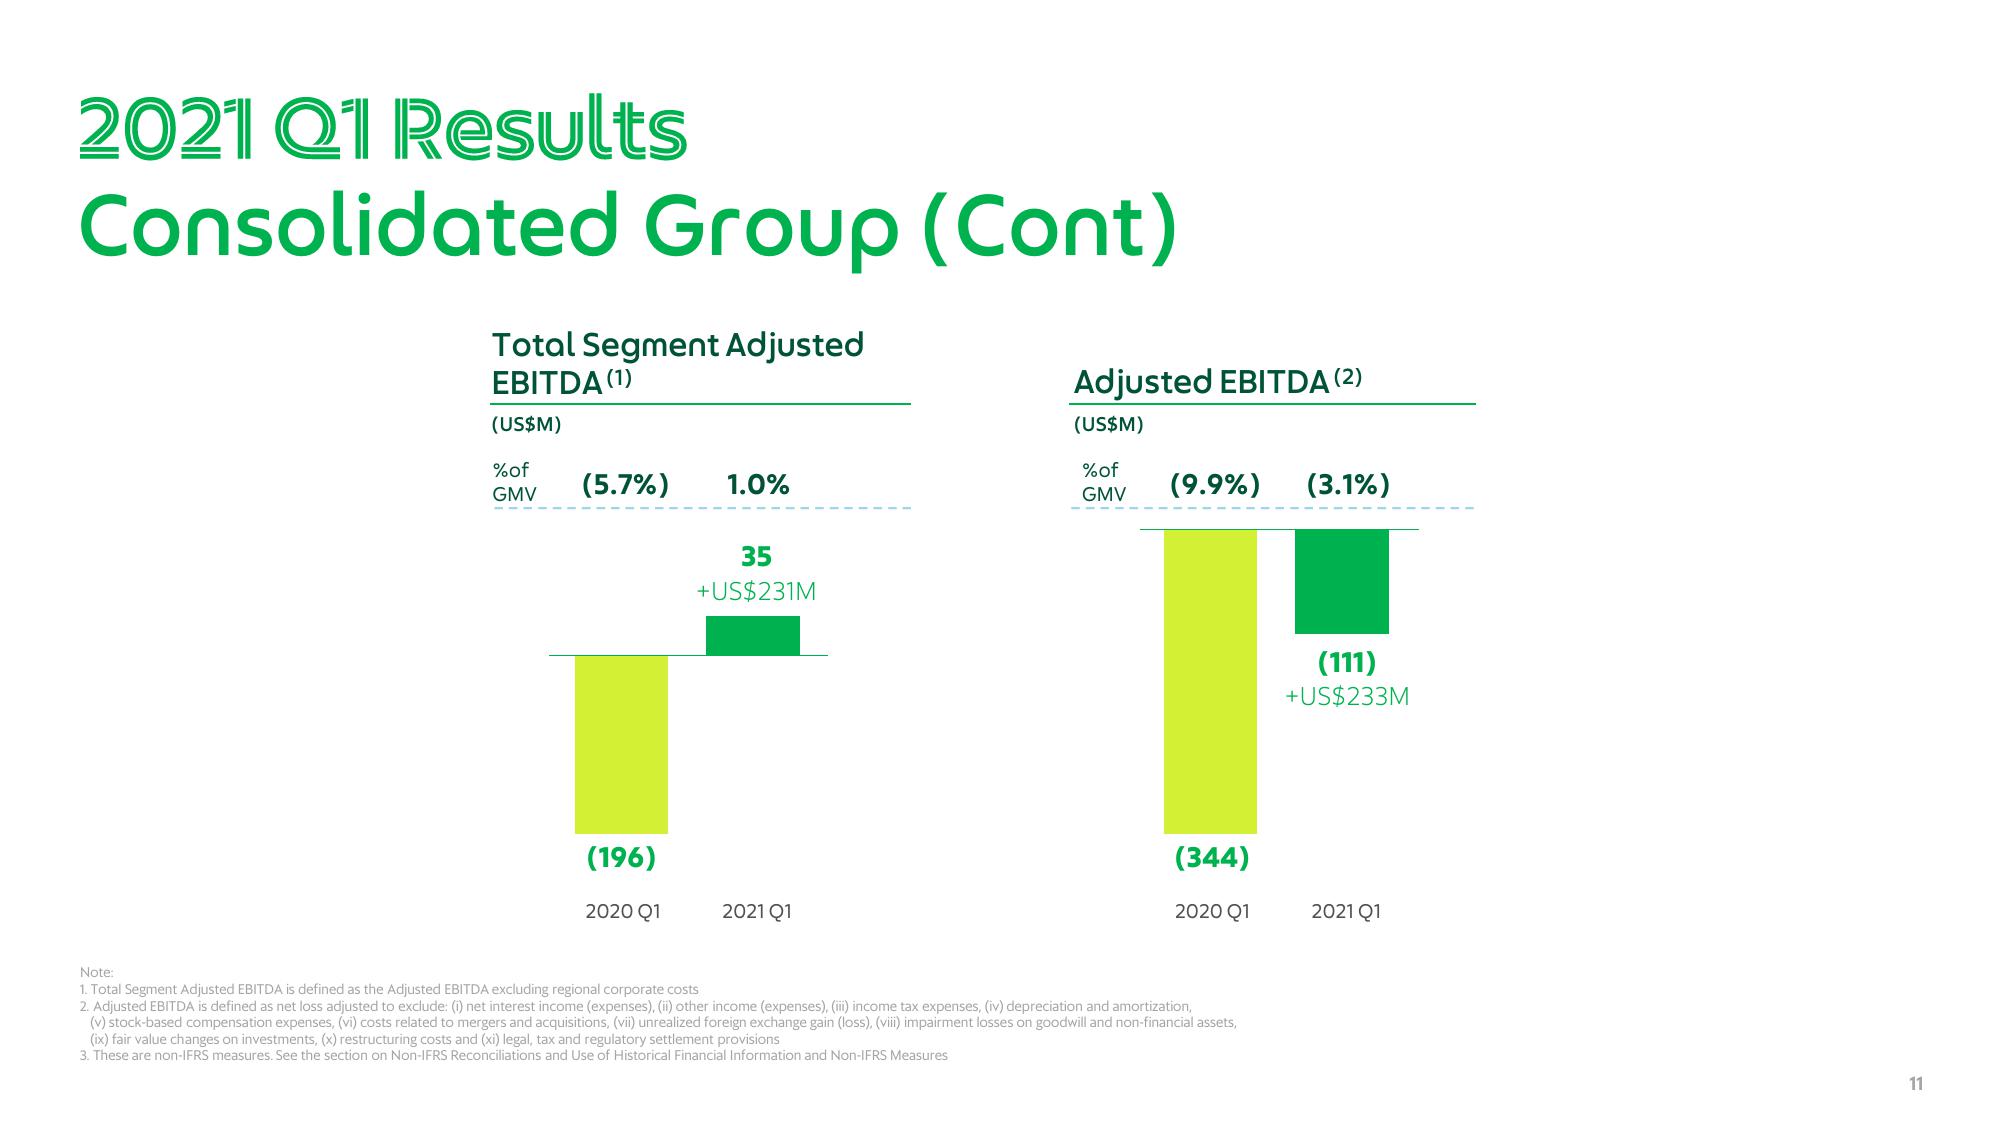
Total Segment Adjusted
EBITDA (¹)
(US$M)
% of
GMV
(5.7%)
(196)
2020 Q1
1.0%
35
+US$231M
2021 Q1
Adjusted EBITDA (2)
(US$M)
%of
GMV
(9.9%) (3.1%)
(344)
2020 Q1
Note:
1. Total Segment Adjusted EBITDA is defined as the Adjusted EBITDA excluding regional corporate costs
2. Adjusted EBITDA is defined as net loss adjusted to exclude: (i) net interest income (expenses), (ii) other income (expenses), (iii) income tax expenses, (iv) depreciation and amortization,
(v) stock-based compensation expenses, (vi) costs related to mergers and acquisitions, (vii) unrealized foreign exchange gain (loss), (viii) impairment losses on goodwill and non-financial assets,
(ix) fair value changes on investments, (x) restructuring costs and (xi) legal, tax and regulatory settlement provisions
3. These are non-IFRS measures. See the section on Non-IFRS Reconciliations and Use of Historical Financial Information and Non-IFRS Measures
(111)
+US$233M
2021 Q1
11View entire presentation