UBS Results Presentation Deck
Global Wealth Management
Total revenues,
m
4,904
1,310
(2%)
Profit before tax,
m
1Q22
4,792
(7%)
1,215
1Q23
UBS Balances as of quarter-end
USDm, except where indicated
Total revenues
Net interest income
Recurring net fee income
Transaction-based income
Other income
Credit loss expense / (release)
Operating expenses
Profit before tax
Cost / income ratio
Invested assets, bn
Fee-generating assets, bn
Deposits, bn
Loans, bn
1Q23 4Q22 1Q22 QoQ
4,601 4,904 +4% (2%)
4,792
1,491 1,499 1,141 (1%) +31%
2,454 2,399 2,806 +2% (13%)
843 658 954 +28% (12%)
3
(7)
15
3,561
1,215
74%
45
3
224
YoY
77% 73% (3pp) +1pp
2,962 2,815 3,145 +5% (6%)
1,335 1,271 1,414 +5% (6%)
330 348 372 (5%) (11%)
230 (1%) (3%)
3,540 3,602 +1% (1%)
1,058 1,310 +15% (7%)
225
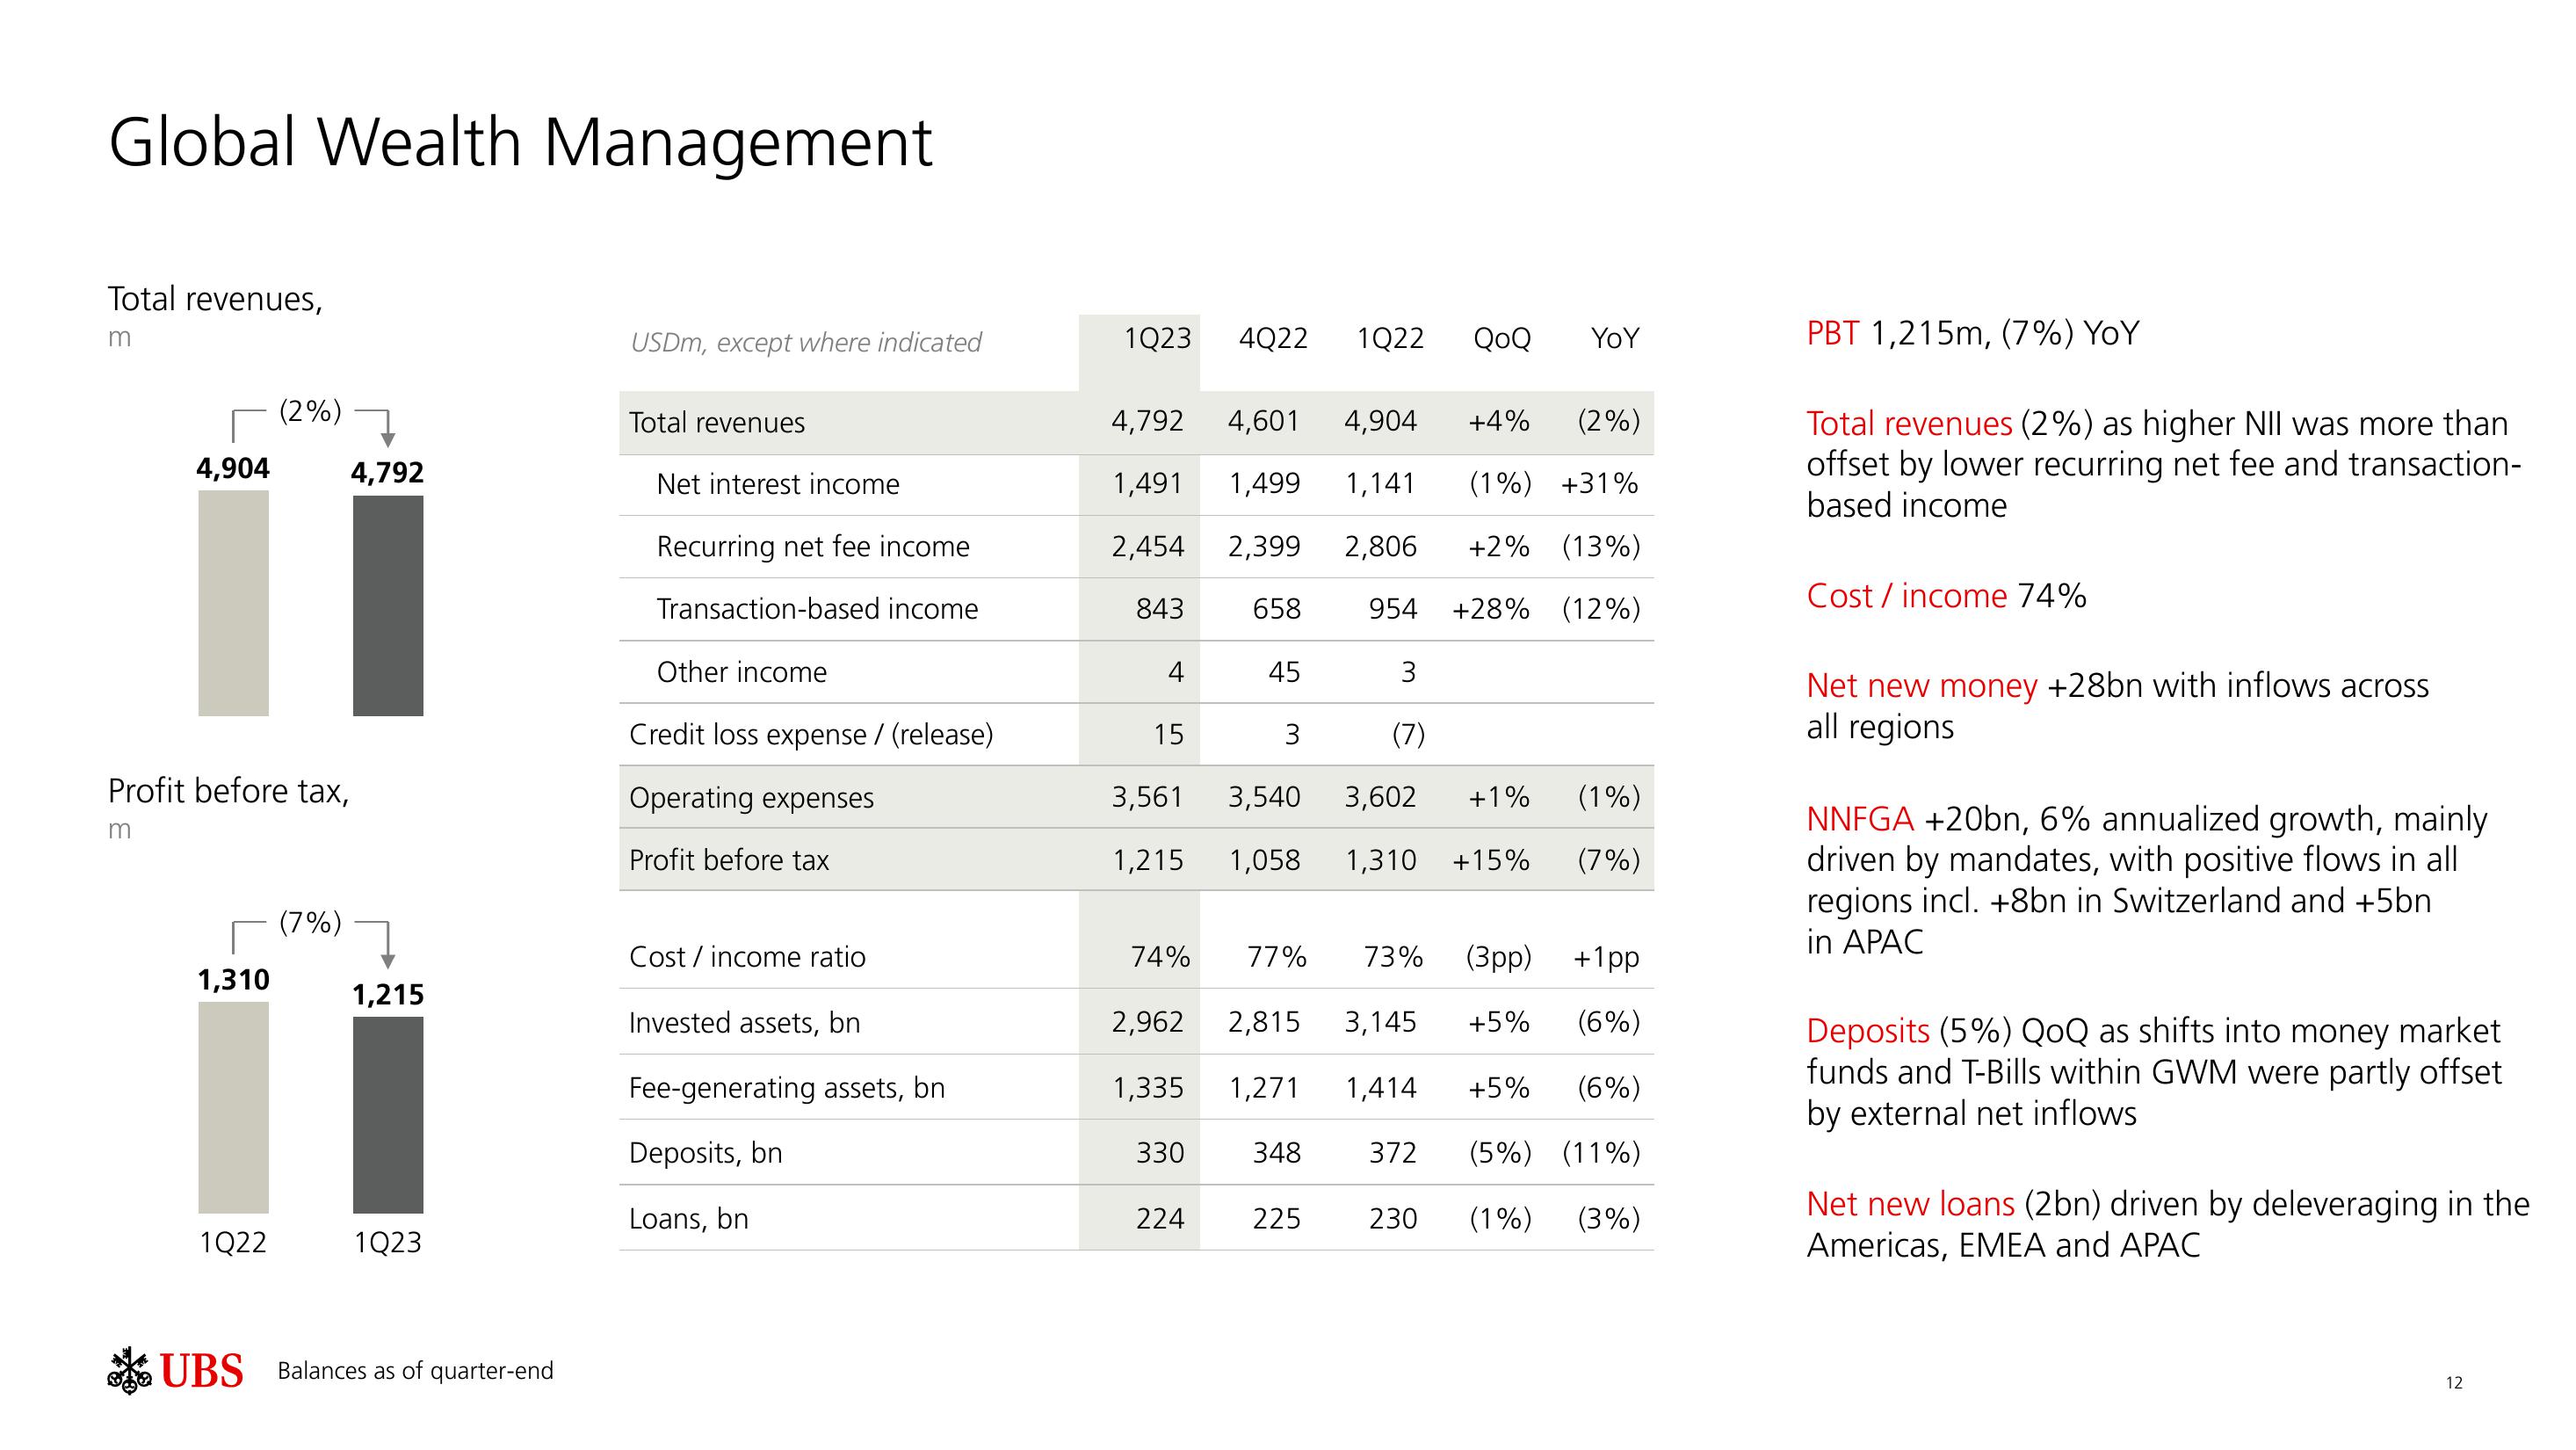
PBT 1,215m, (7%) YoY
Total revenues (2%) as higher NII was more than
offset by lower recurring net fee and transaction-
based income
Cost/income 74%
Net new money +28bn with inflows across
all regions
NNFGA +20bn, 6% annualized growth, mainly
driven by mandates, with positive flows in all
regions incl. +8bn in Switzerland and +5bn
in APAC
Deposits (5%) QoQ as shifts into money market
funds and T-Bills within GWM were partly offset
by external net inflows
Net new loans (2bn) driven by deleveraging in the
Americas, EMEA and APAC
12View entire presentation