DraftKings Results Presentation Deck
Q2 and Current Business Highlights
1
2
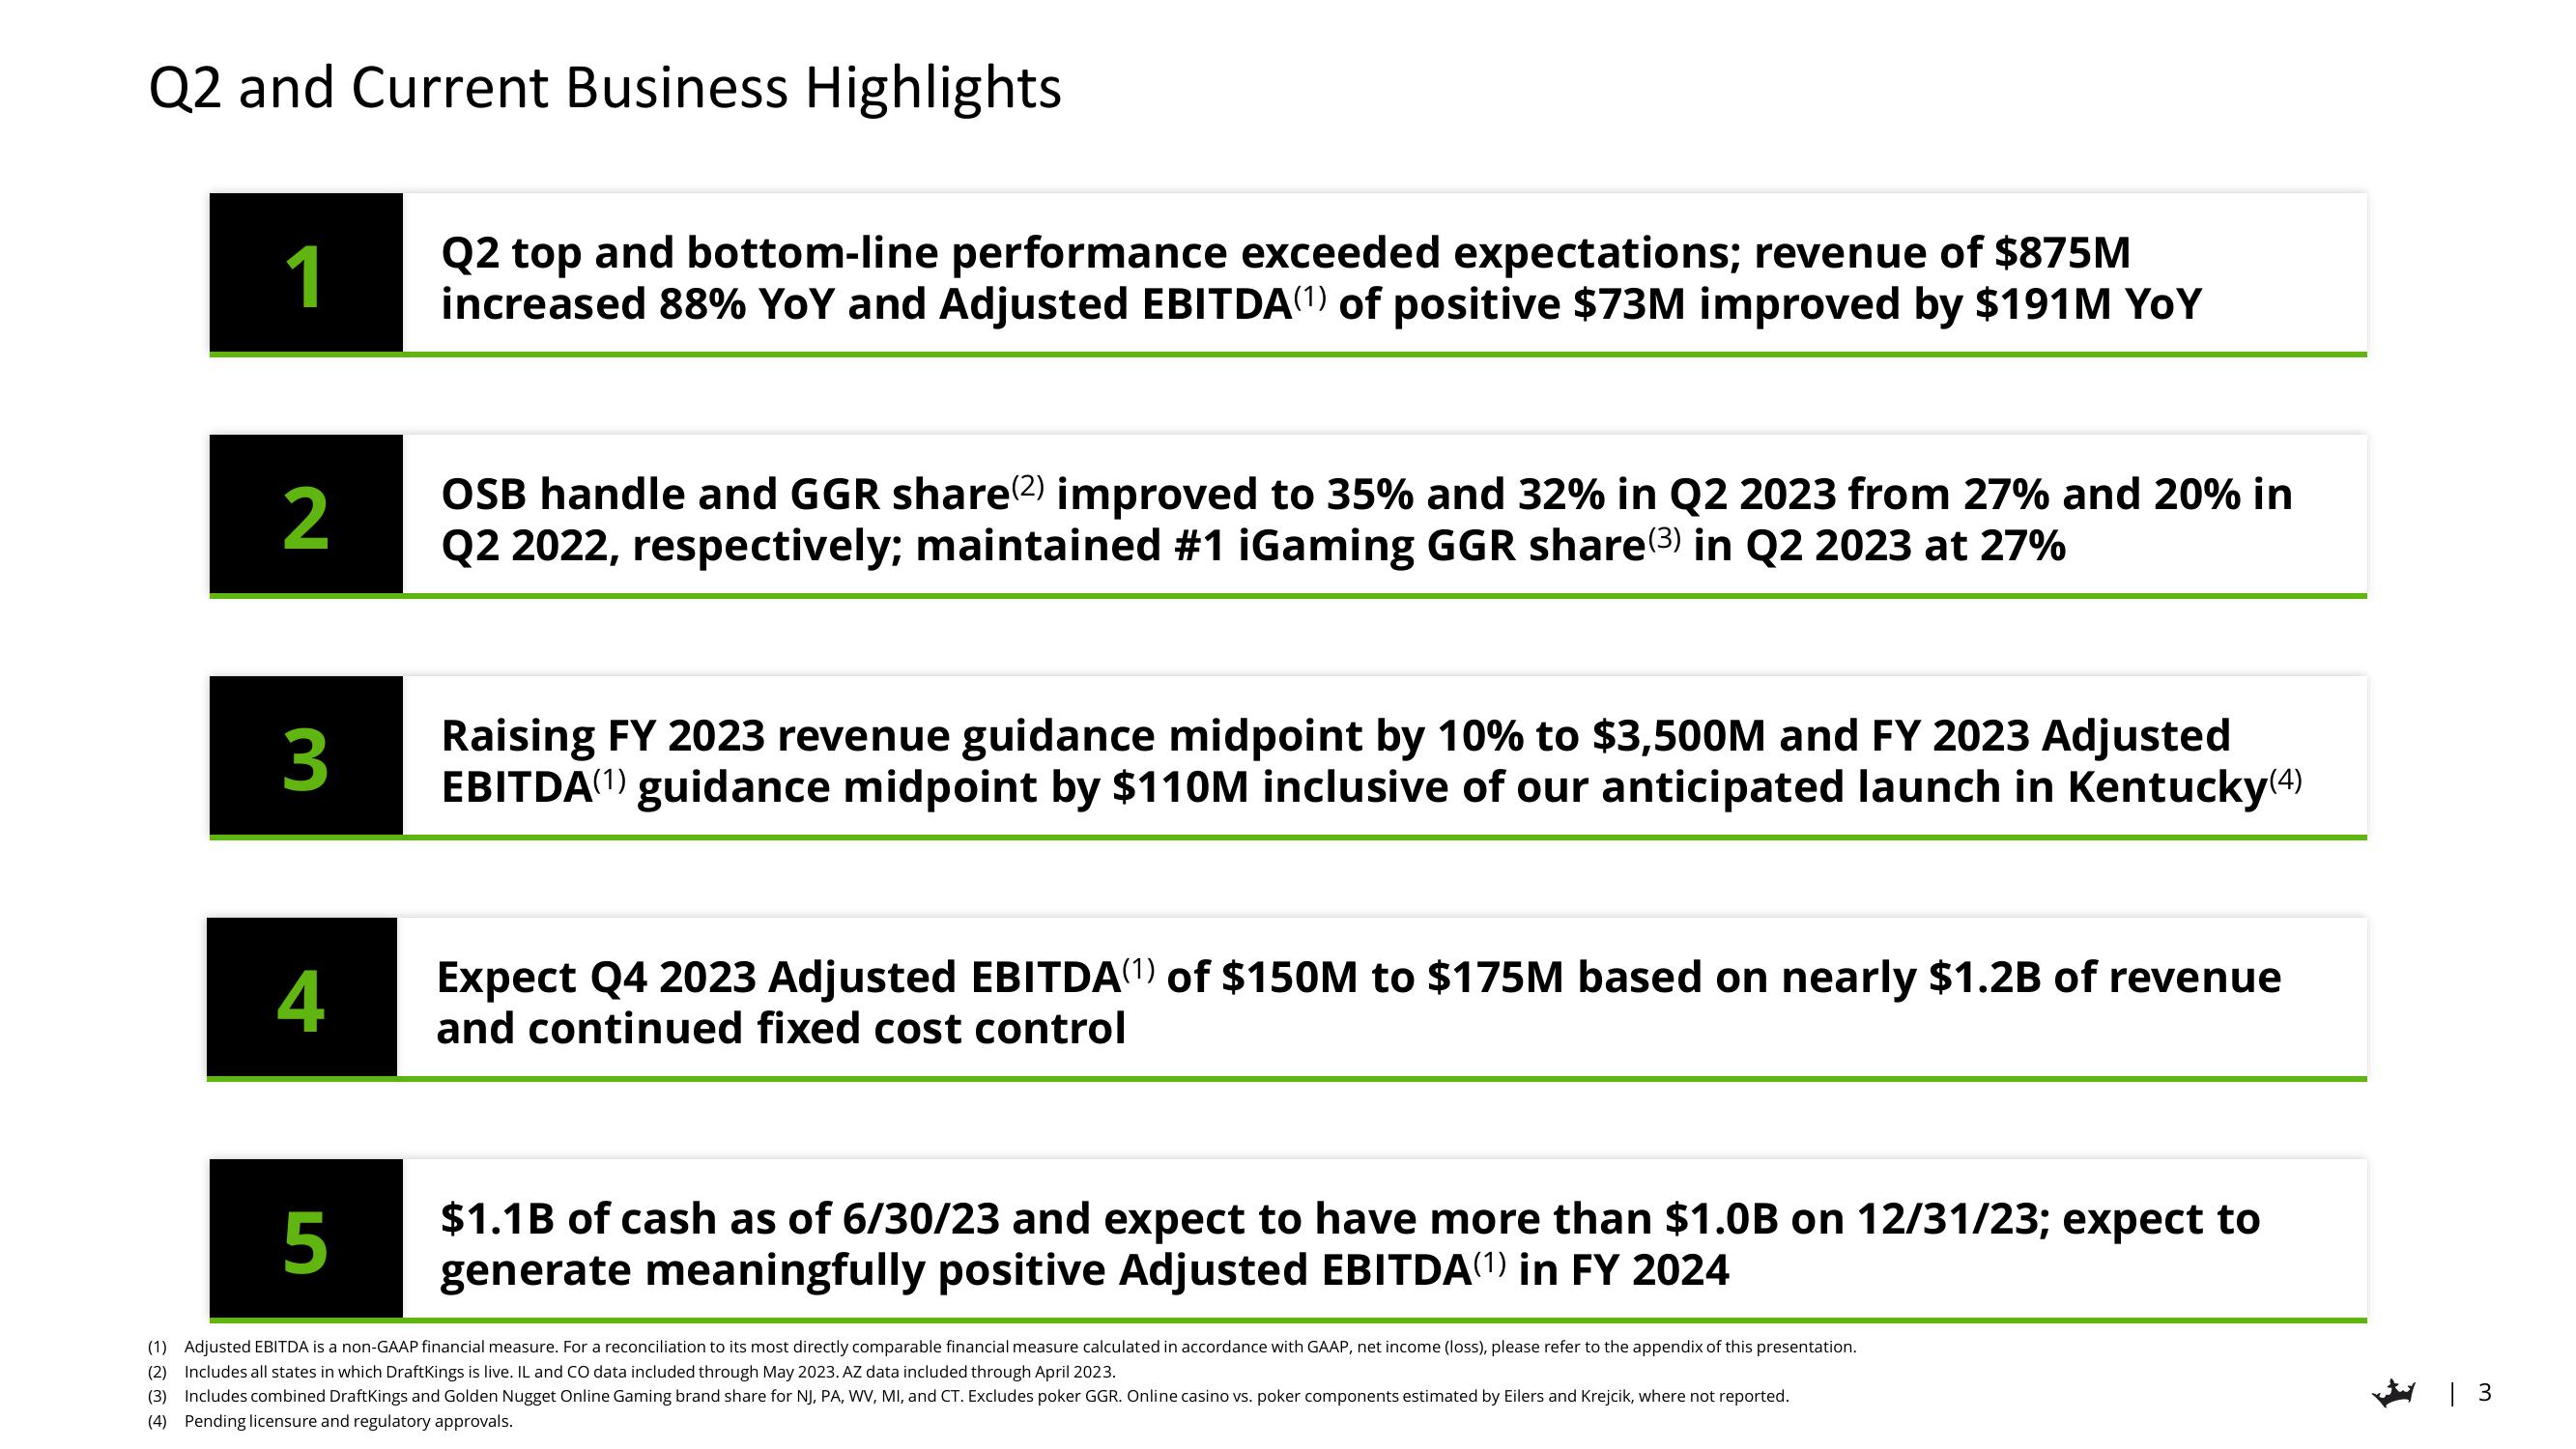
OSB handle and GGR share(2) improved to 35% and 32% in Q2 2023 from 27% and 20% in
Q2 2022, respectively; maintained #1 iGaming GGR share (3) in Q2 2023 at 27%
3
Q2 top and bottom-line performance exceeded expectations; revenue of $875M
increased 88% YoY and Adjusted EBITDA(¹) of positive $73M improved by $191M YOY
4
Raising FY 2023 revenue guidance midpoint by 10% to $3,500M and FY 2023 Adjusted
EBITDA(¹) guidance midpoint by $110M inclusive of our anticipated launch in Kentucky(4)
Expect Q4 2023 Adjusted EBITDA(¹) of $150M to $175M based on nearly $1.2B of revenue
and continued fixed cost control
$1.1B of cash as of 6/30/23 and expect to have more than $1.0B on 12/31/23; expect to
generate meaningfully positive Adjusted EBITDA(¹) in FY 2024
5
(1) Adjusted EBITDA is a non-GAAP financial measure. For a reconciliation to its most directly comparable financial measure calculated in accordance with GAAP, net income (loss), please refer to the appendix of this presentation.
(2) Includes all states in which DraftKings is live. IL and CO data included through May 2023. AZ data included through April 2023.
(3) Includes combined DraftKings and Golden Nugget Online Gaming brand share for NJ, PA, WV, MI, and CT. Excludes poker GGR. Online casino vs. poker components estimated by Eilers and Krejcik, where not reported.
(4) Pending licensure and regulatory approvals.
| 3View entire presentation