DraftKings Results Presentation Deck
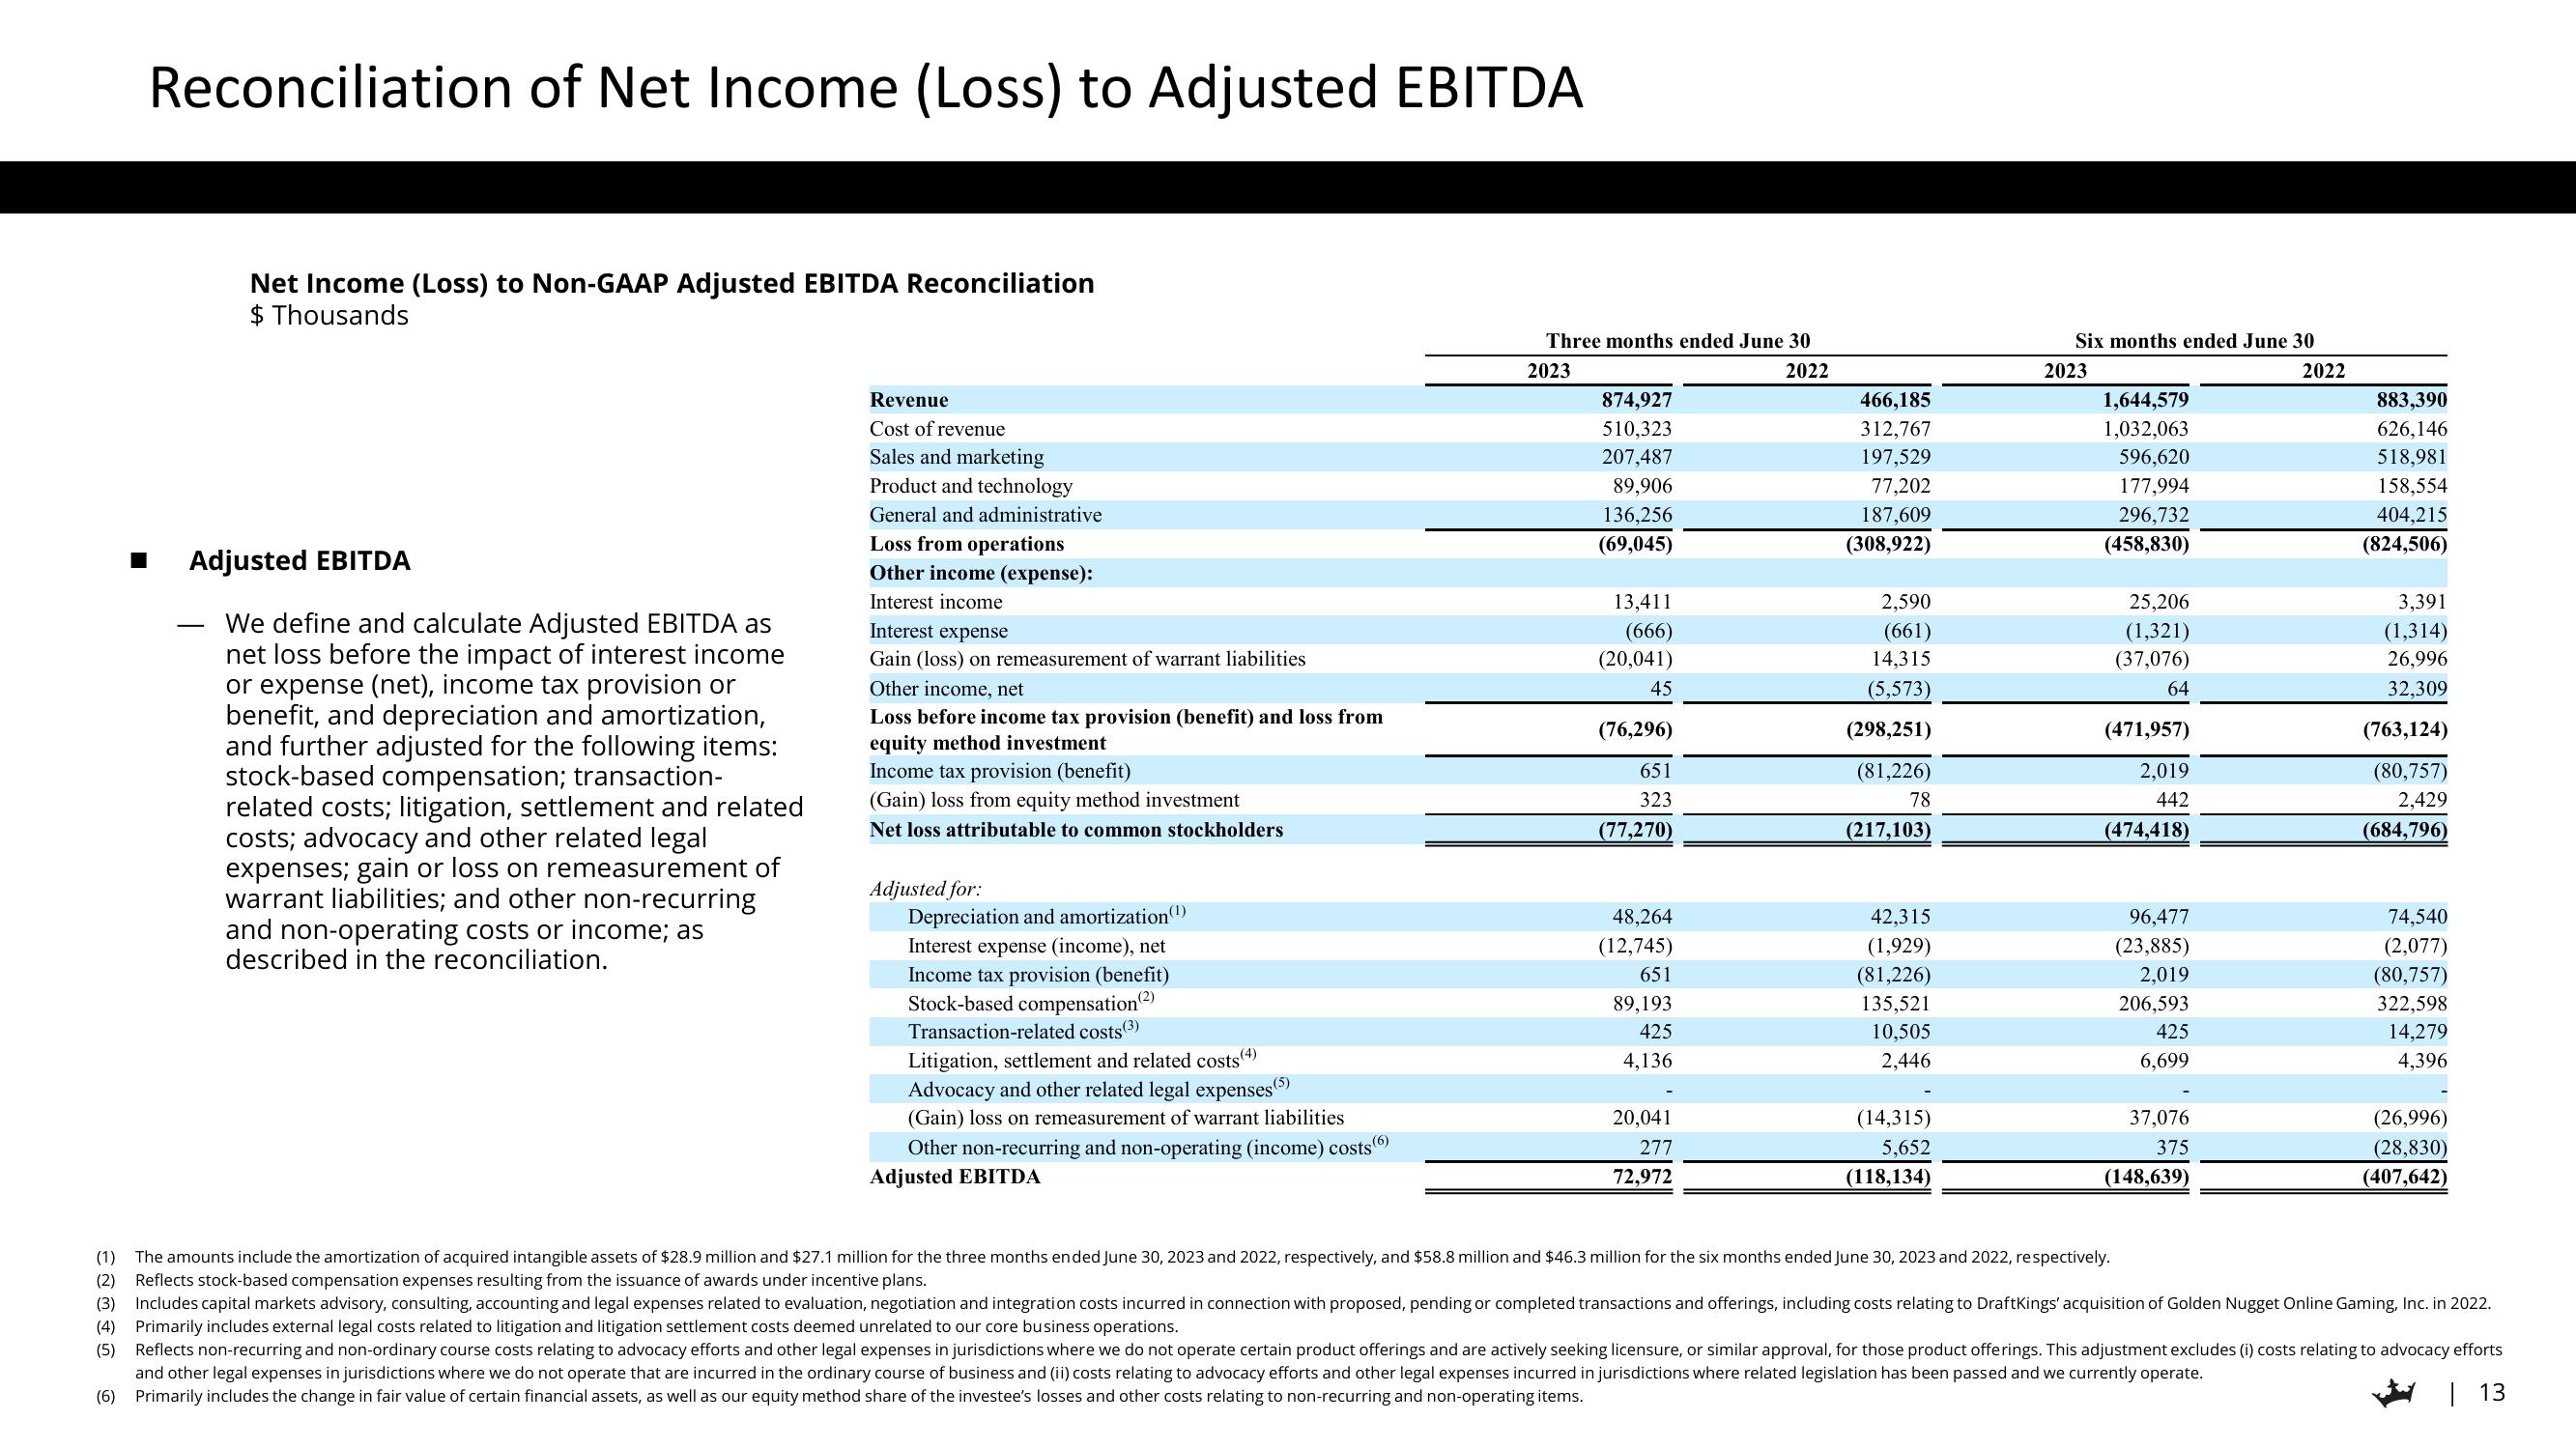
Reconciliation of Net Income (Loss) to Adjusted EBITDA
O
Net Income (Loss) to Non-GAAP Adjusted EBITDA Reconciliation
$ Thousands
Adjusted EBITDA
We define and calculate Adjusted EBITDA as
net loss before the impact of interest income
or expense (net), income tax provision or
benefit, and depreciation and amortization,
and further adjusted for the following items:
stock-based compensation; transaction-
related costs; litigation, settlement and related
costs; advocacy and other related legal
expenses; gain or loss on remeasurement of
warrant liabilities; and other non-recurring
and non-operating costs or income; as
described in the reconciliation.
Revenue
Cost of revenue
Sales and marketing
Product and technology
General and administrative
Loss from operations
Other income (expense):
Interest income
Interest expense
Gain (loss) on remeasurement of warrant liabilities
Other income, net
Loss before income tax provision (benefit) and loss from
equity method investment
Income tax provision (benefit)
(Gain) loss from equity method investment
Net loss attributable to common stockholders
Adjusted for:
Depreciation and amortization (¹)
Interest expense (income), net
Income tax provision (benefit)
Stock-based compensation (²)
Transaction-related costs (3)
Litigation, settlement and related costs (4)
Advocacy and other related legal expenses (5)
(Gain) loss on remeasurement of warrant liabilities
Other non-recurring and non-operating (income) costs
Adjusted EBITDA
(6)
Three months ended June 30
2023
2022
874,927
510,323
207,487
89,906
136,256
(69,045)
13,411
(666)
(20,041)
45
(76,296)
651
323
(77,270)
48,264
(12,745)
651
89,193
425
4,136
20,041
277
72,972
466,185
312,767
197,529
77,202
187,609
(308,922)
2,590
(661)
14,315
(5,573)
(298,251)
(81,226)
78
(217,103)
42,315
(1,929)
(81,226)
135,521
10,505
2,446
(14,315)
5,652
(118,134)
Six months ended June 30
2023
1,644,579
1,032,063
596,620
177,994
296,732
(458,830)
25,206
(1,321)
(37,076)
64
(471,957)
2,019
442
(474,418)
96,477
(23,885)
2,019
206,593
425
6,699
37,076
375
(148,639)
2022
883,390
626,146
518,981
158,554
404,215
(824,506)
3,391
(1,314)
26,996
32,309
(763,124)
(80,757)
2,429
(684,796)
74,540
(2,077)
(80,757)
322,598
14,279
4,396
(26,996)
(28,830)
(407,642)
(1) The amounts include the amortization of acquired intangible assets of $28.9 million and $27.1 million for the three months ended June 30, 2023 and 2022, respectively, and $58.8 million and $46.3 million for the six months ended June 30, 2023 and 2022, respectively.
(2) Reflects stock-based compensation expenses resulting from the issuance of awards under incentive plans.
(3) Includes capital markets advisory, consulting, accounting and legal expenses related to evaluation, negotiation and integration costs incurred in connection with proposed, pending or completed transactions and offerings, including costs relating to DraftKings' acquisition of Golden Nugget Online Gaming, Inc. in 2022.
(4) Primarily includes external legal costs related to litigation and litigation settlement costs deemed unrelated to our core business operations.
(5) Reflects non-recurring and non-ordinary course costs relating to advocacy efforts and other legal expenses in jurisdictions where we do not operate certain product offerings and are actively seeking licensure, or similar approval, for those product offerings. This adjustment excludes (i) costs relating to advocacy efforts
and other legal expenses in jurisdictions where we do not operate that are incurred in the ordinary course of business and (ii) costs relating to advocacy efforts and other legal expenses incurred in jurisdictions where related legislation has been passed and we currently operate.
(6) Primarily includes the change in fair value of certain financial assets, as well as our equity method share of the investee's losses and other costs relating to non-recurring and non-operating items.
| 13View entire presentation